AMD Is Still Going

Readers will see below that Advanced Micro Devices ($AMD) built a Rising Wedge pattern of bearish reversal while running into late June. The shares then caught a bid close to a 38.6% Fibonacci retracement of that entire rally in late July.
This past August the stock had flirted with taking back both its 21-day EMA and 50-day SMA, but failed to do so at that time, forming a Triangle pattern in the process.
This week, AMD has broken out of that pattern and taken back both of those key moving averages. This forces both swing traders and professional managers to play ball with each other.
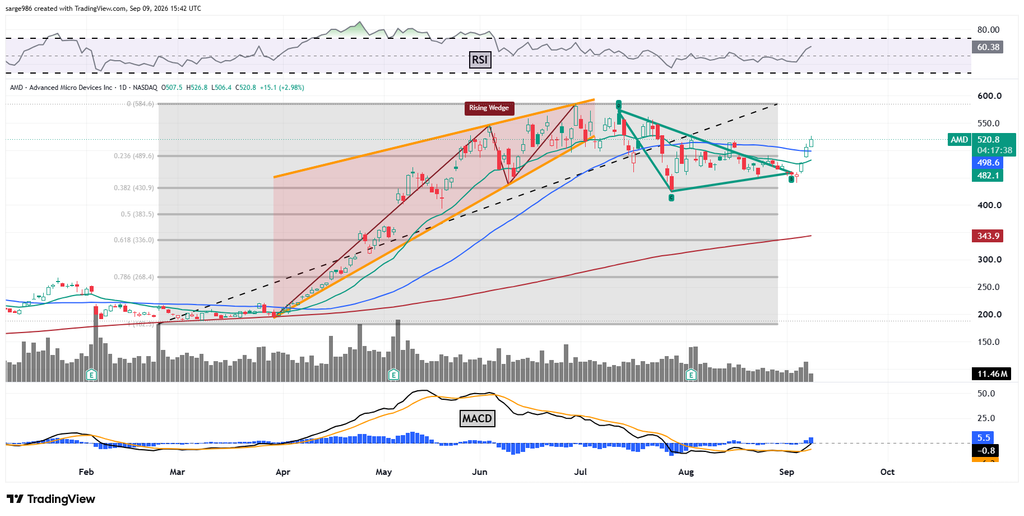
Looking at the indicators, both Relative Strength and the stock’s daily MACD are suddenly looking much more bullish. The histogram of the 9-day EMA has now regained the zero-line while the 12-day EMA has overtaken the 26-day EMA. Should both of those lies go positive, this stock could very likely see an algorithmic boost on top of the current action.
Target Price: $700 (reiteration)
Pivot: Recent 50-day SMA ($499)
Add: Down to previously tested Fib level
Panic: Loss of said Fib level
Position: Long AMD equity
