Bearish Bets: 3 Names That Have Been Left Out in the Cold


These three charts have big problems and they are only going to get bigger.
While we will not weigh in with fundamental analysis on these issues, we will pop the hood for a look at the charts.
Let’s dig in:
Ford Chart Is in Reverse
There’s nothing worse than your stock taking a nosedive while the rest of the market is surging. That is called relative strength, or in the case of Ford ($F), relative weakness. After spiking to multi-year highs early in June the stock has come tumbling down to earth, it doesn’t appear ready to stop, either.
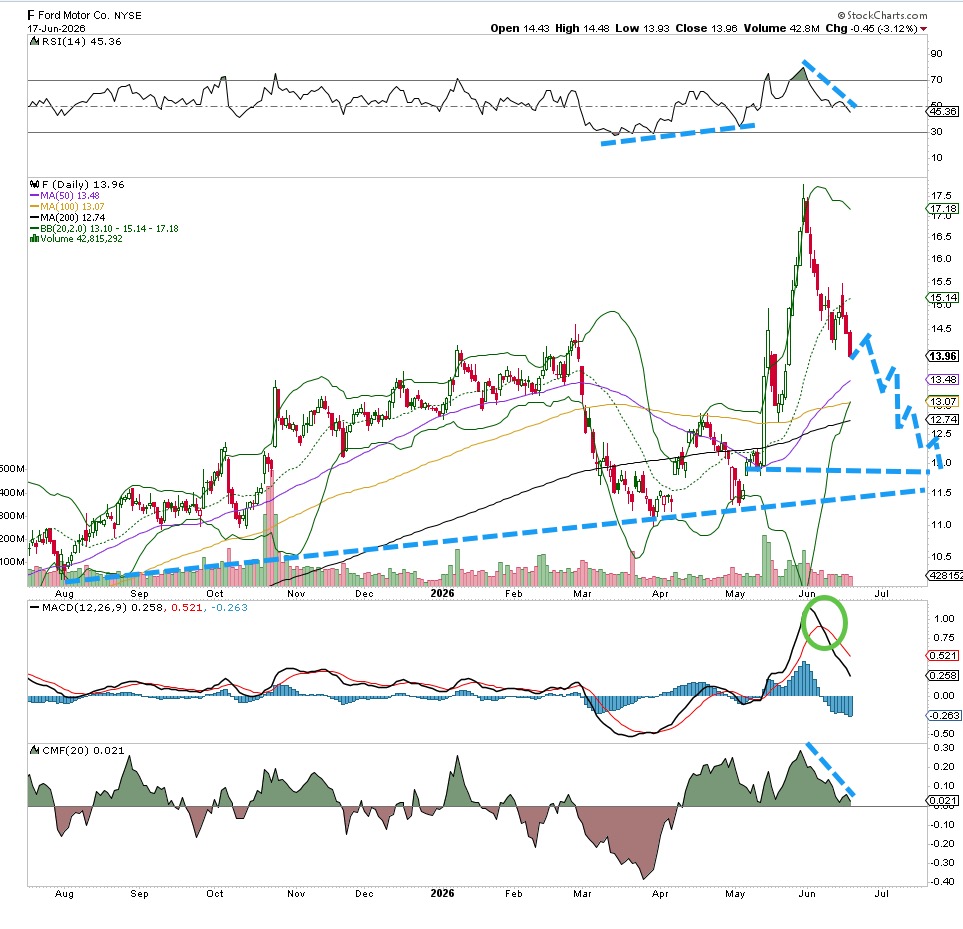
Money flow is poor and about to go negative, The trend line from August comes in around the $11.50 level, MACD is on a sell signal, while RSI is just plain weak.
Let’s consider a short trade here to the $12 and then $11 area. This stock remains weak and could continue for a bit longer until it gets oversold. Put in a stop at $15 just in case.
Baidu’s Channel Reflects Strong Bearish Sentiment
The ugliness in the big Chinese technology stocks is being shown by names like Baidu ($BIDU), which has been weak for more than a month. The stock was on a tear in the spring but ran into some big sellers around the $150 level, and now there is room to move down. The recent slide has the stock on the bottom side of the downtrend channel, which tells us any rally is simply being sold.
Money flow is bearish, the MACD on a sell signal and RSI is weak and pointing lower. There are no bullish qualities in the chart, but certainly room for lower prices.
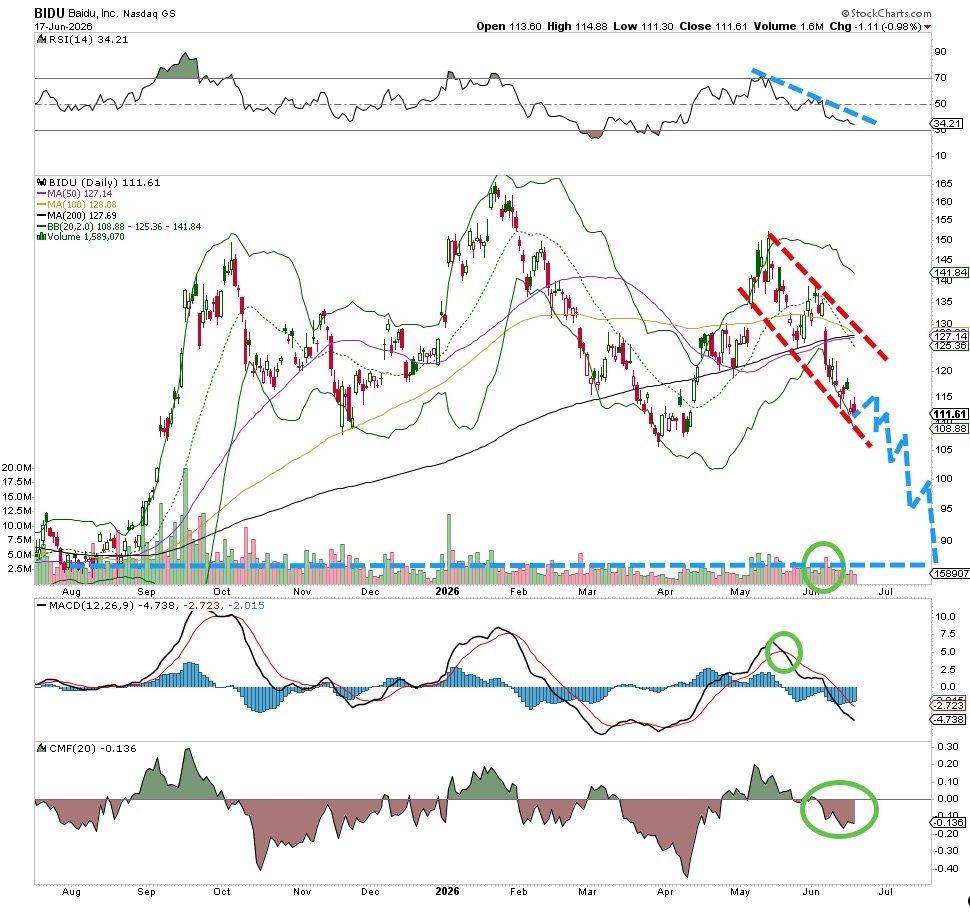
Let’s target the August lows with an aggressive move short, staying patient for the $85 level. Use a stop at $130 just in case.
The Nasdaq Stock Wishes It Could Act More Like the Index
Shares of exchanges such as the Nasdaq ($NDAQ), CME Group ($CME) and Intercontinental Exchange ($ICE) have had their troubles recently. The former ($NDAQ) was really belted this week on heavy volume, with big sellers coming in and hitting the stock rather hard. Money flow is suddenly bearish, while the MACD has been on a sell signal for weeks. That downtrend line from the $100 area was stiff resistance as Nasdaq tried to make a run, but to no avail.
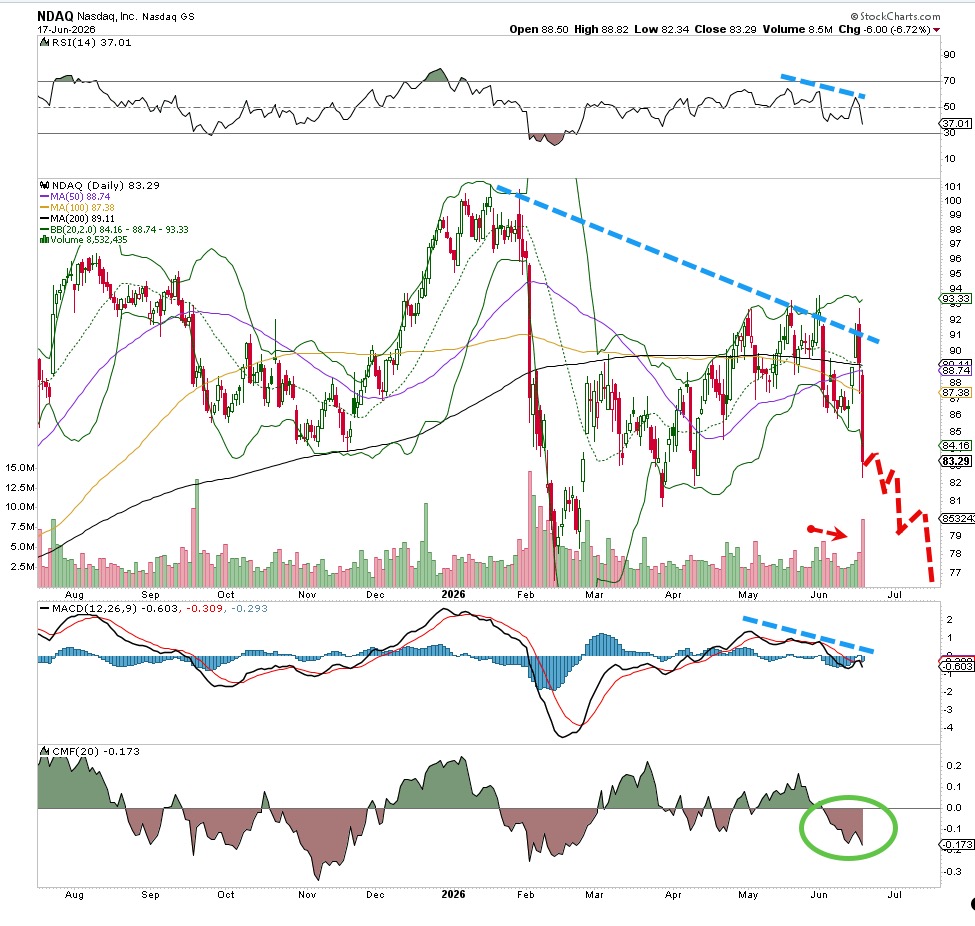
RSI is making lower highs and is not quite oversold yet. That leaves some room for more downside.
Let’s target the February lows for now, call it $77 or so, and put in a stop at $92 just in case. This is a very weak chart with heavy volume to the downside on June 17. Lookout below.
This article is being shared as premium content from TheStreet Pro. It was written by Bob Lang.
