Wall Street’s ‘Fear Gauges’ Just Jumped the Most in Years. Here’s What Usually Came Next.

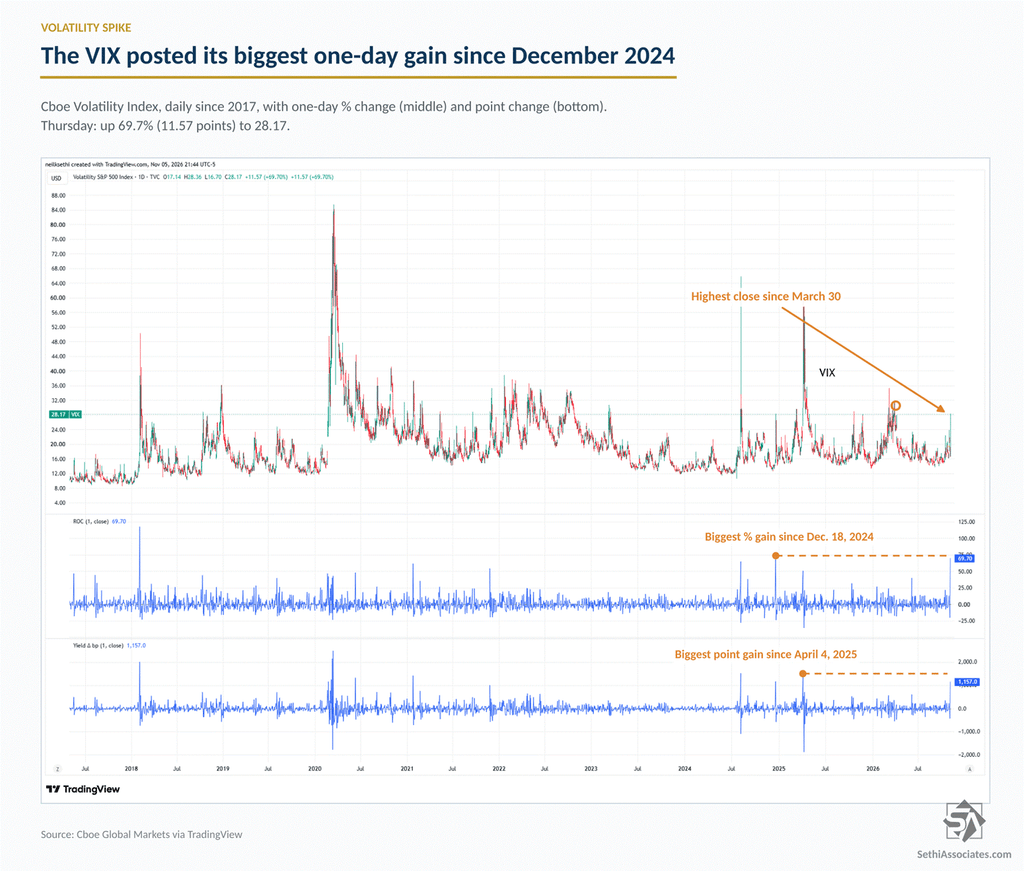
The Cboe Volatility Index (VIX) closed Thursday up 69.7% at 28.17, its biggest one-day percentage gain since December 18, 2024, and the second largest since the February 2018 “Volmageddon.” It was also the VIX’s highest close since March 30, and its 11.6-point jump was the biggest since April 4, 2025.
That turned the midday spike I wrote about (Investor ‘Fear’ Returns) into one of the largest on record. Only two days since Cboe’s data begin in 1990 saw bigger gains: February 5, 2018 (+116%) and December 18, 2024 (+74%). It’s a sharp reversal from Wednesday, when the VIX had its biggest drop since April 2025 (Investor ‘Fear’ Is Dropping the Most Since April 2025).
The VIX of the VIX
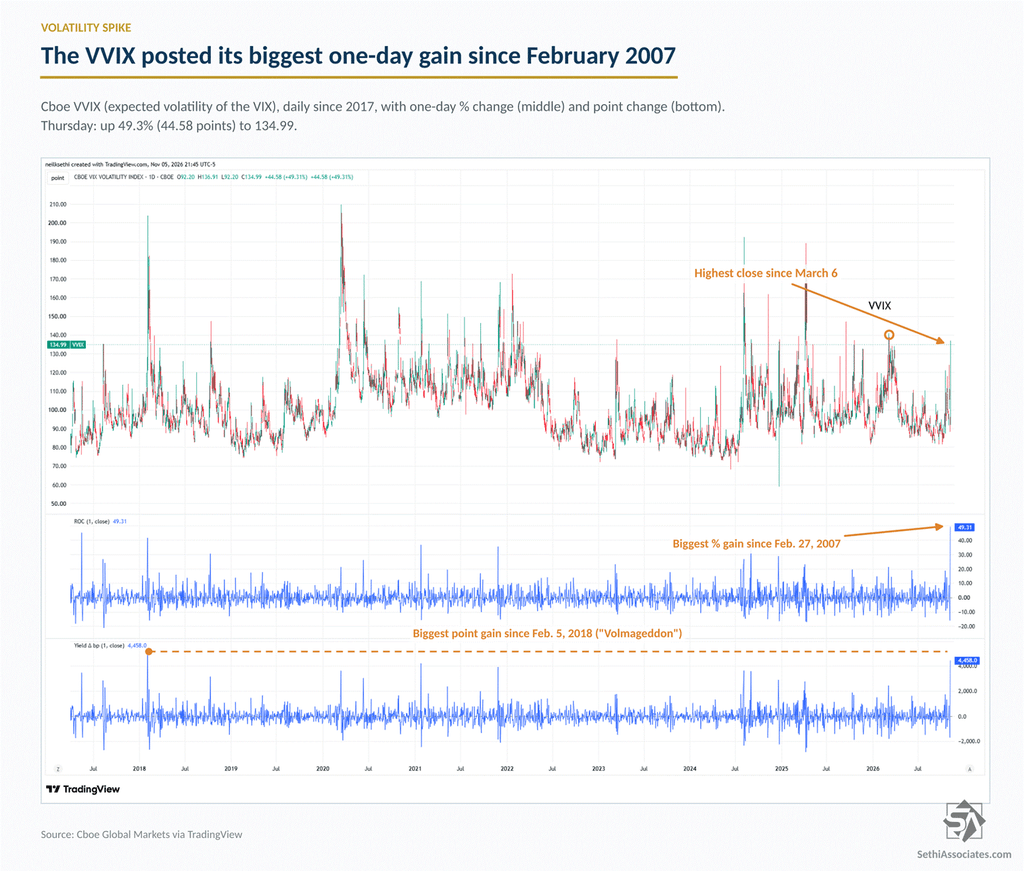
The stress was even more prevalent in the market for volatility itself. The Cboe VVIX, which tracks how much traders expect the VIX to swing over the next 30 days, jumped 49.3% to 134.99, its biggest one-day percentage gain since February 2007 and its highest close since March 6. In points, it was the biggest jump since Volmageddon in 2018.
A move like that suggests traders were rushing to buy protection against further spikes in volatility, not just against a drop in stocks.
What History Says
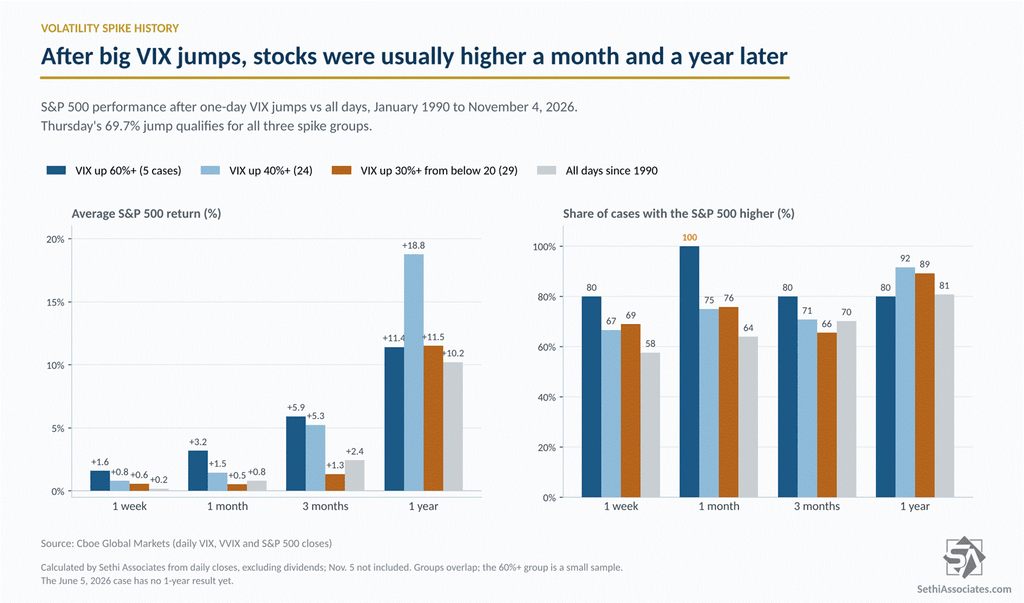
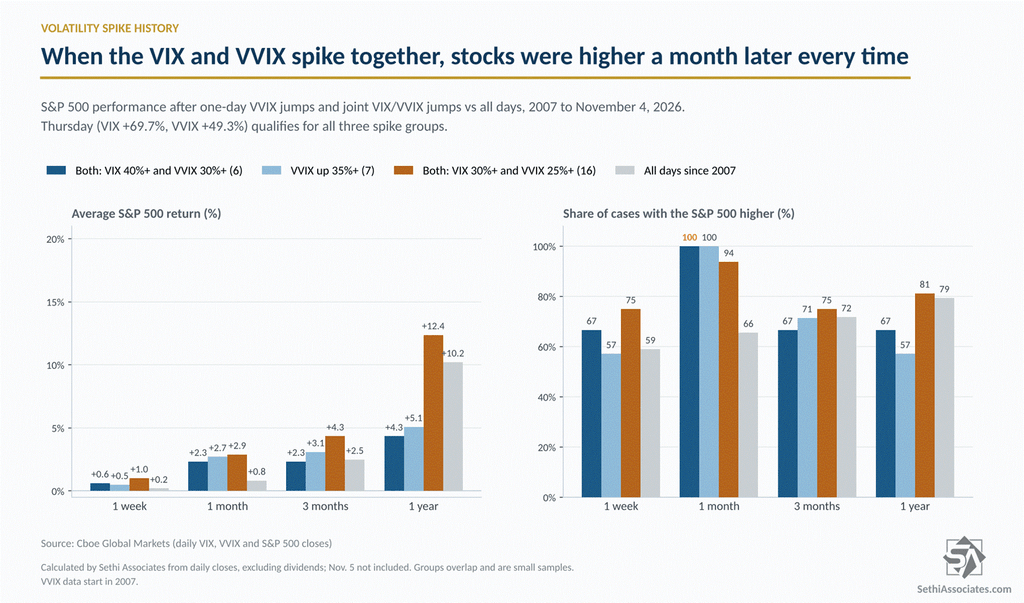
Spikes like this have usually faded, and stocks have usually been higher a month later, according to Cboe data. Before Thursday, the VIX had risen 60% or more in a single day only five times since 1990, and the S&P 500 was higher a month later in all five. In the 24 cases of a 40%-plus jump, the index was higher a month later in 18 and a year later in 22, by an average of almost 19%, nearly double its typical annual gain.
When both gauges spike together, the one-month record is even stronger. In the six times since 2007 that the VIX rose at least 40% and the VVIX at least 30% on the same day, the S&P 500 was higher a month later every time. The year-later record was weaker, though, with gains in only four of the six and an average of about 4%, well below the typical 10%.
The Caveats
These are small samples, and the worst outcomes came when the spike marked the start of a bigger shock, such as February 2020, when the S&P 500 was down 24% a month later as the pandemic took hold.
Also, spikes from a calm starting point, like this one (the VIX came into Thursday at 16.61, below its long-run average of about 19), have had more muted follow-through over the next three months. The closest match for both gauges is February 27, 2007, when the VIX jumped 64% from a low base and the VVIX posted its only larger gain on record. The S&P 500 was slightly lower a year later, ahead of the financial crisis.
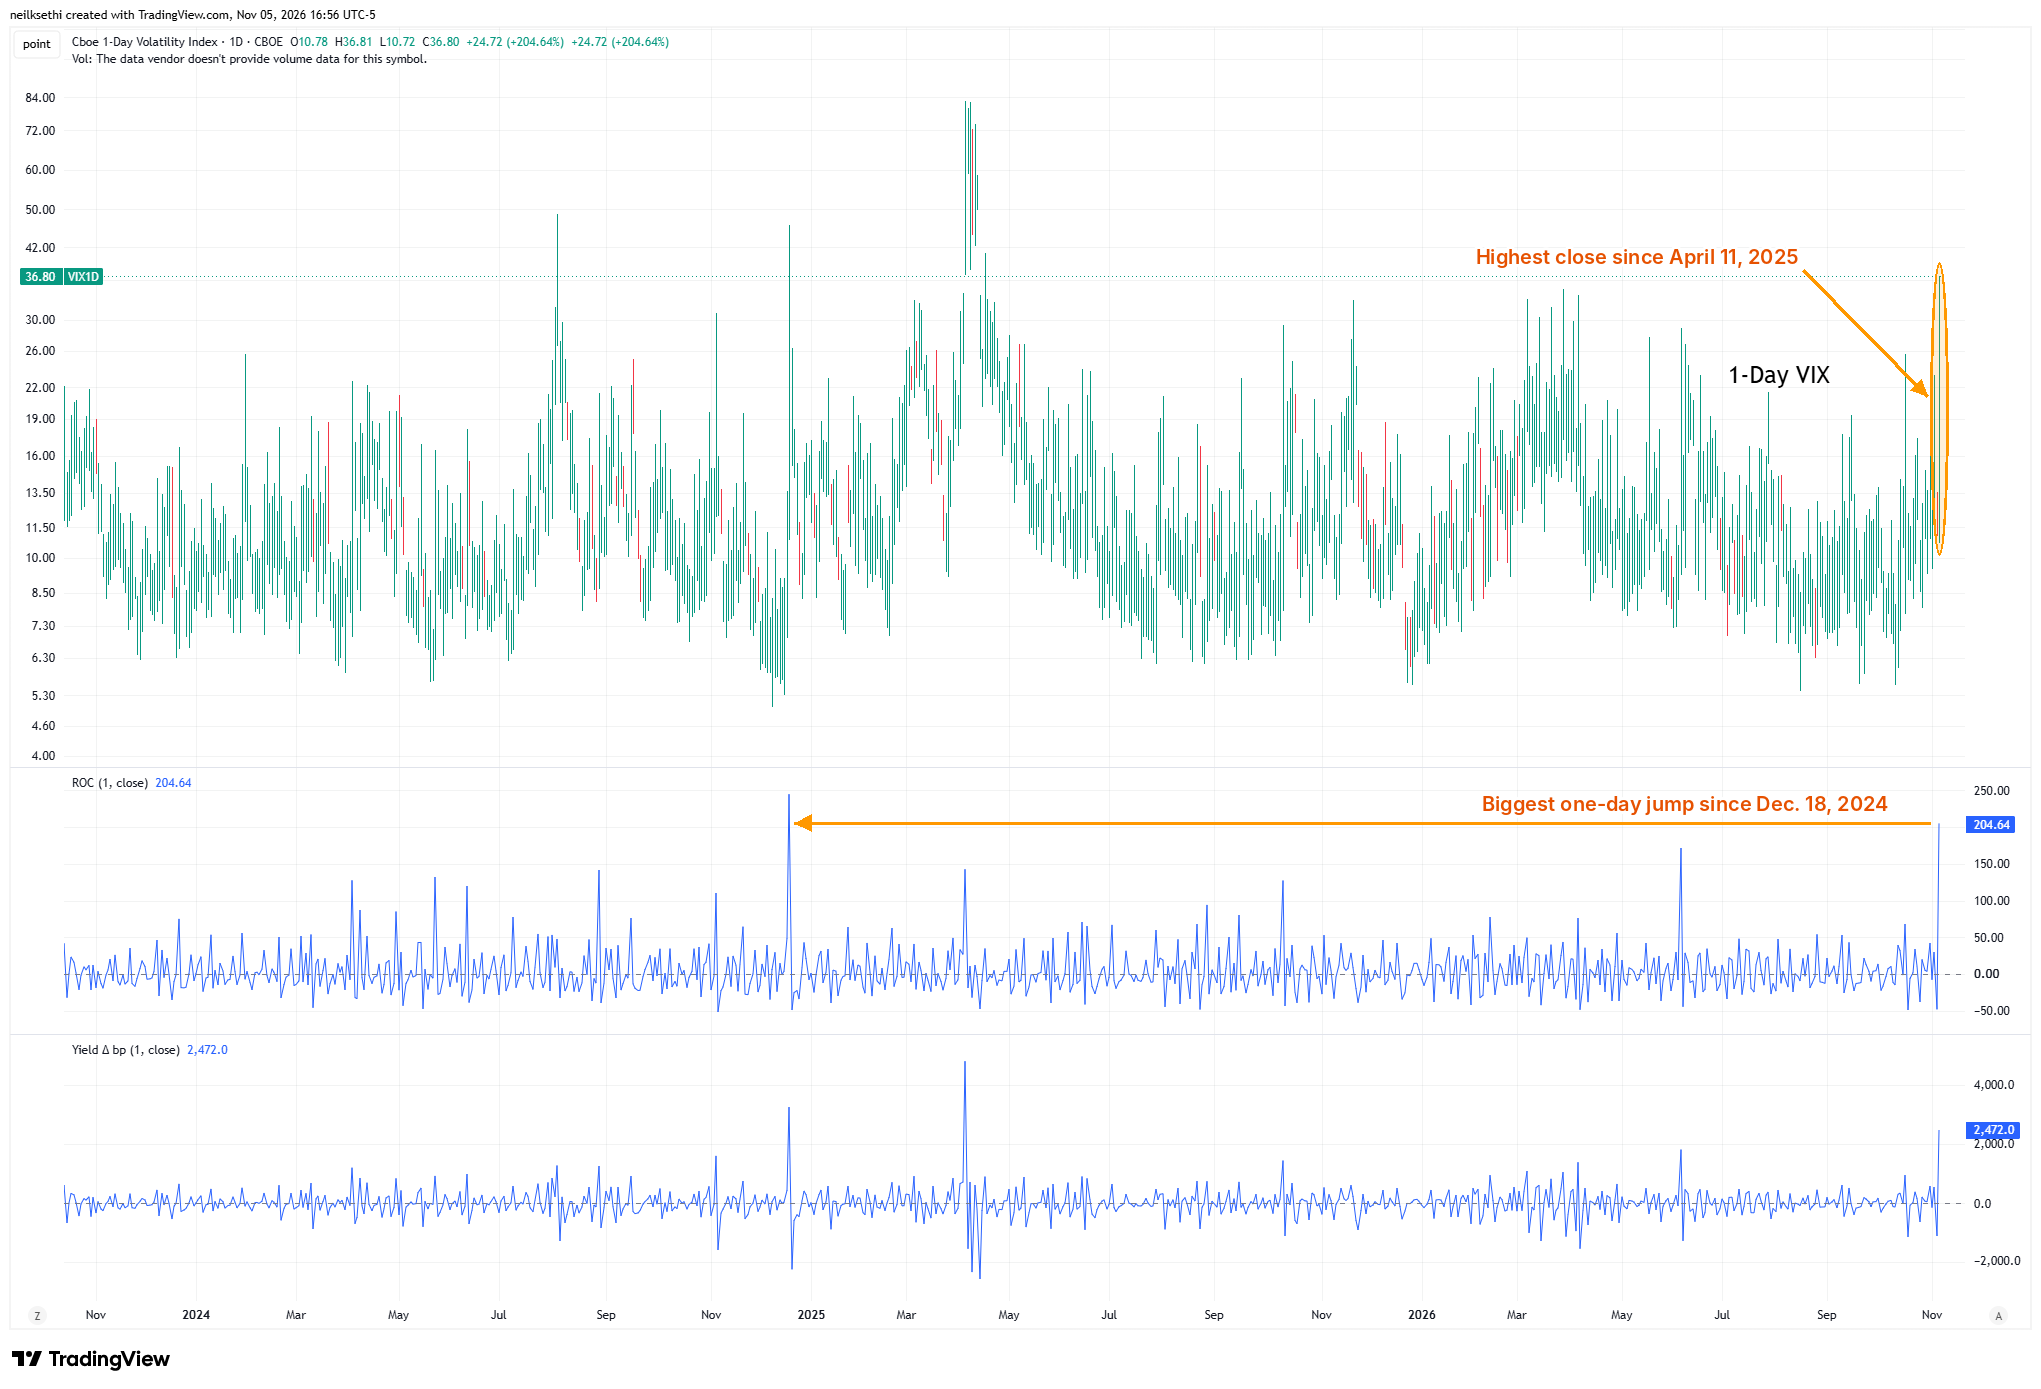
For Friday, the 1-day VIX tripled (its largest move since 2024) to 36.80, implying a move of about 2.3% in the S&P 500.