Boockvar on Inflation, Savings Surprise, More Economic Data
From Peter Boockvar:
Data dump succinct rundown
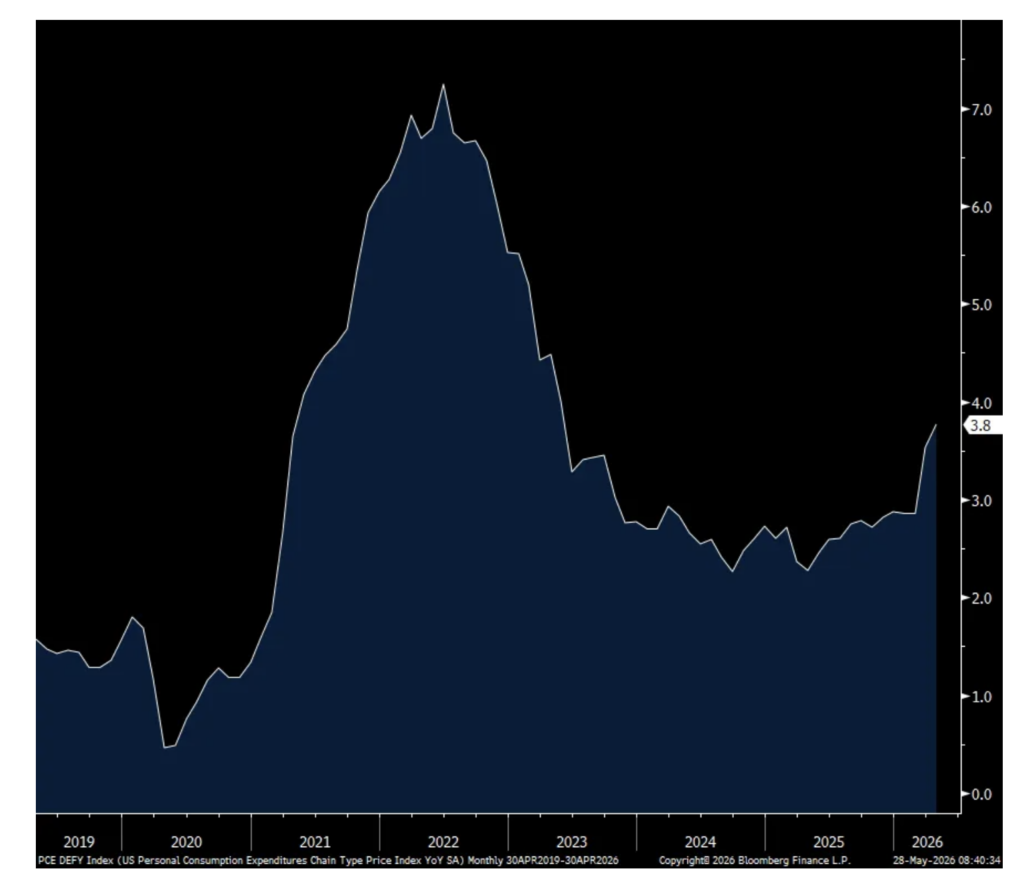
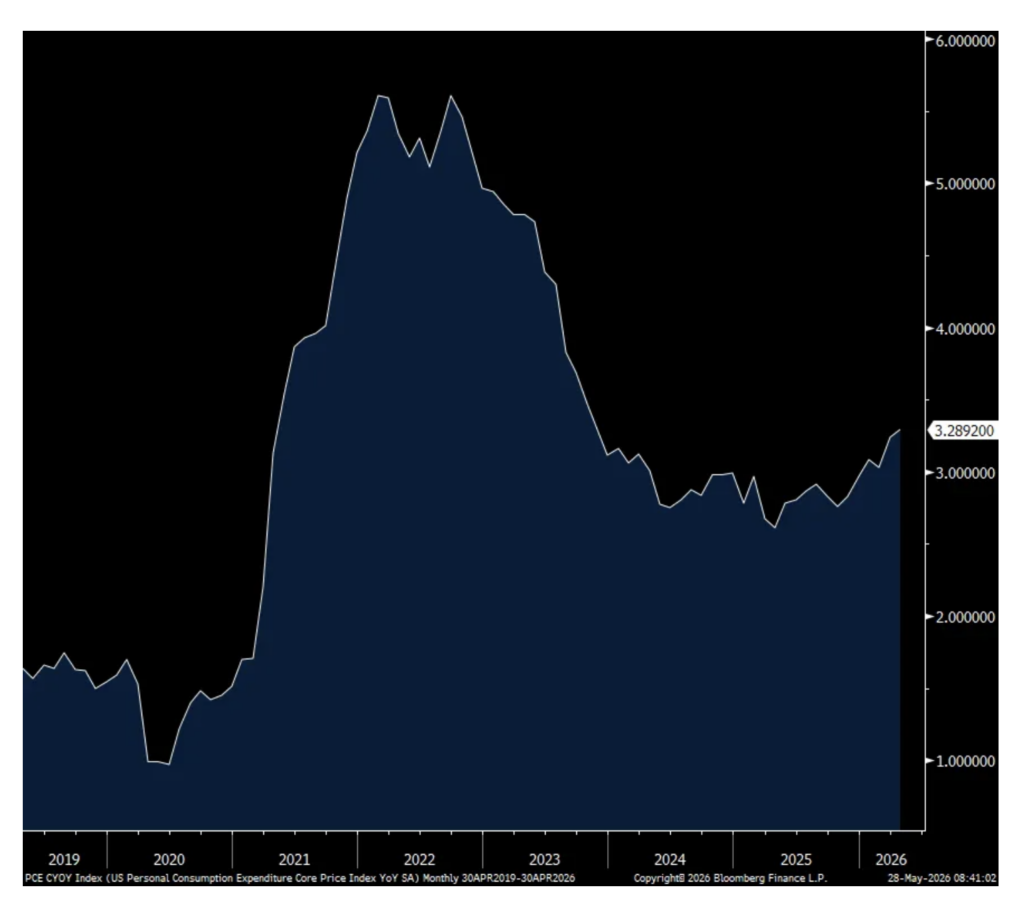
Headline PCE in April rose .4% headline and .2% core m/o/m, both one tenth below the estimate but due to rounding the 3.8% and 3.3% y/o/y gains were as forecasted. As expected, energy prices rose 18.3% y/o/y and food prices were up 2.5%.
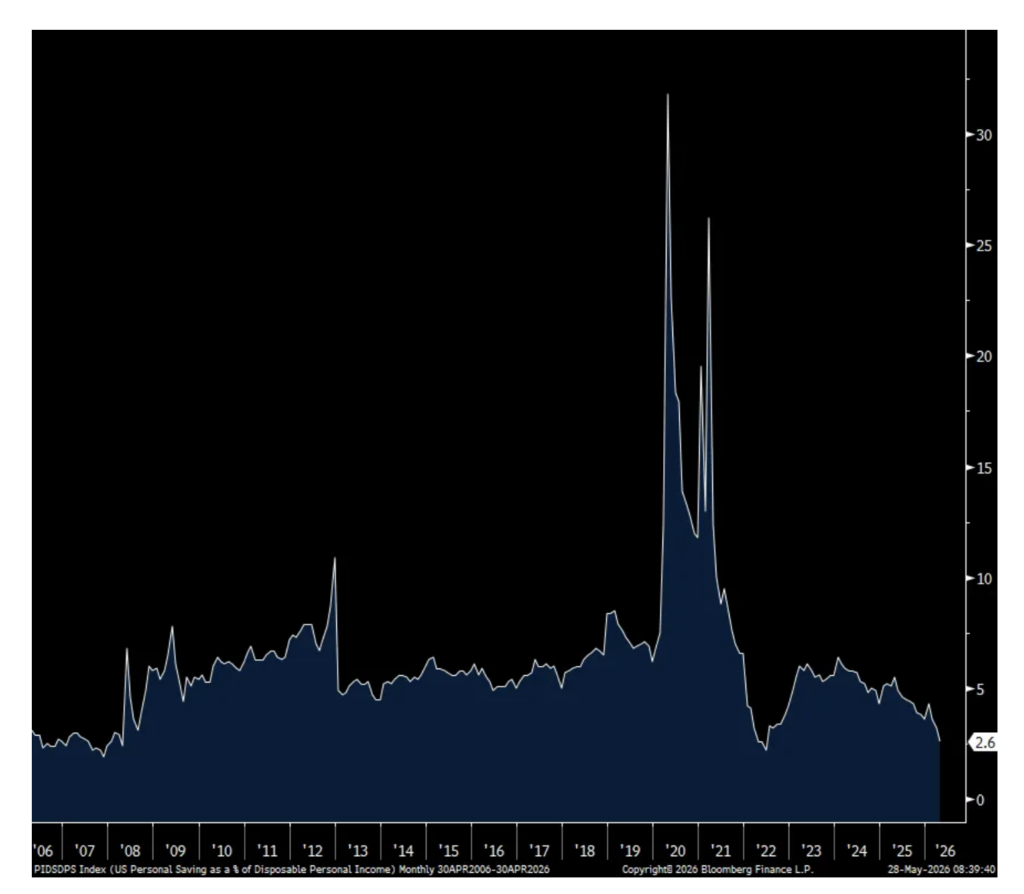
What really stands out in this April data was the big drop in the savings rate to just 2.6% from 3.2% in March, 3.6% in February and 4.3% in January. That matches the lowest level since June 2022 when it got down to 2.2% that month. Go back to 2007 the previous time it was under 2.6%.
Contributing to this was the no change in income growth m/o/m while spending rose .5% and .4% of that spending was inflation. The caveat though with the income drop was that it was mostly due to “The decrease in farm proprietors’ income” which “reflected a decrease in payments to farmers from the Farmer Bridge Assistance Program, which closed application submissions in mid-April.” Private sector wages and salaries, most importantly, rose .3% m/o/m.
Bottom line, inflation is again eating into REAL incomes and draining the savings rate. Also lowering the savings rate is higher stock prices for the upper income earner as that growing wealth is seen as a form of savings. And, the spending growth is mostly price, not volume.
After touching 4.50% again, the 10 yr yield backed off to 4.47%-.48% in response to the inflation, income and spending data.
PCE Headline y/o/y
PCE Core y/o/y
Savings Rate
Q1 GDP was revised lower to a gain of 1.6% from the first print of 2% and vs expectations of no change. Tweaks down in personal consumption and gross private investment were the main reasons. Final sales to private domestic purchases was revised just a hair lower to 2.4% growth from 2.5% initially.
For perspective, 150 bps of the GDP growth was from spending on ‘information processing’, ‘software’ and ‘R&D.’
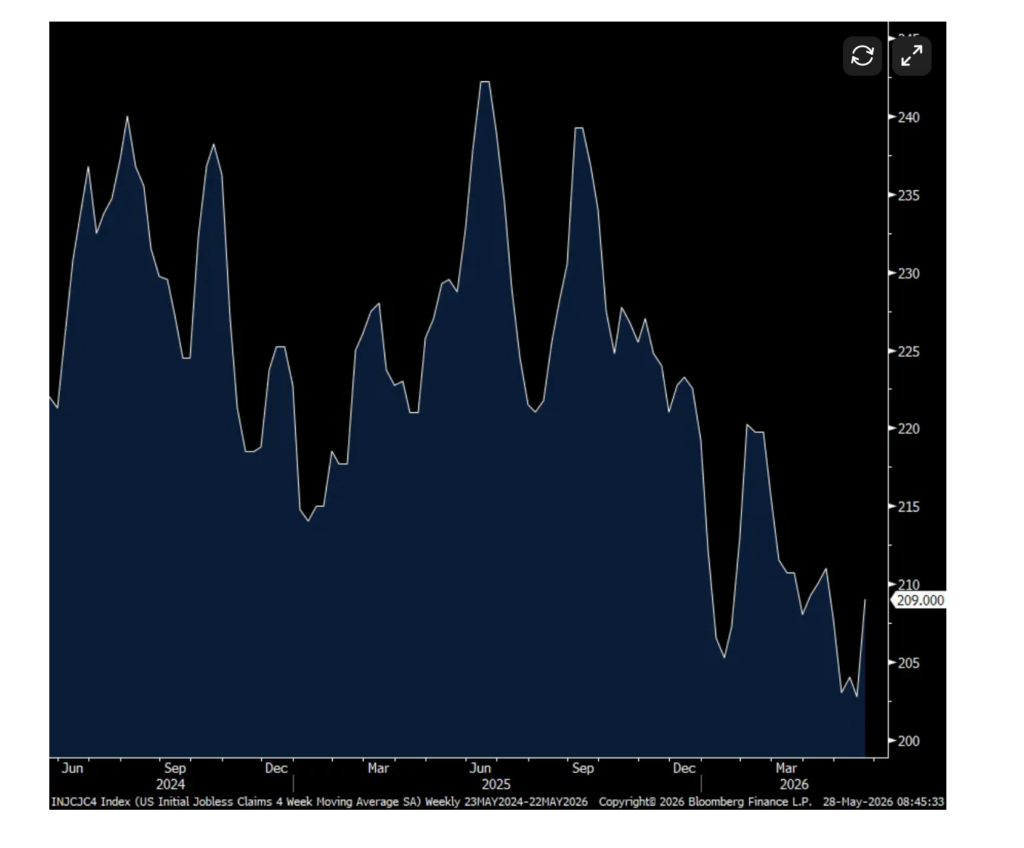
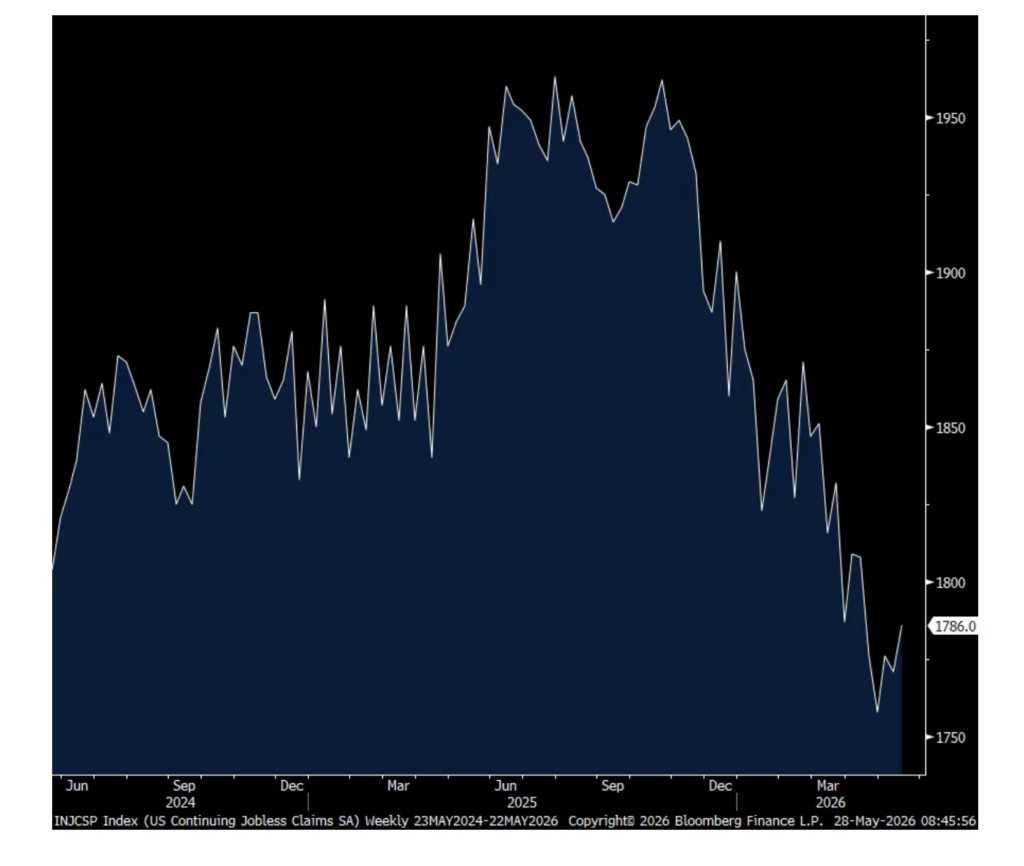
Initial jobless claims ticked up by 5k w/o/w to 215k and that was 4k above the estimate. The 4 week average moved up to 209k from 203k as a print of 190k drops out from 5 weeks ago. Continuing claims rose to 1.786mm as expected from 1.771mm but remaining below 1.9mm.
Overall, the bottom line continues to be the same with the slow pace of firing’s as measured here while continuing claims can be impacted by either the modest inflows of new filers, claims expiring, and/or people are finding new jobs.
4 week avg in Initial Claims
Continuing Claims
Core durable goods orders in April fell 1.1% m/o/m vs the expected gain of .4%, partly offset by a 5 tenths upward revision to the blockbuster month seen in March when they rose 3.9%.
Notwithstanding the orders pullback after the strong March, strength in anything touching the data center construction continues to be robust with an 18.8% y/o/y rise in computers/electronics, 5.8% increase in electrical equipment, 11.6% gain in machinery and you can’t build anything without metals as primary metals orders rose 13.6% y/o/y and fabricated metals were higher by 10%.
Core shipments, which get plugged into GDP, were about as expected.
Positions: None.