Wayfair Faces a Fork in the Road But I’m Bullish


Mirror, mirror, on the wall, I ask, who is the fairest? Is it actually Wayfair ($W)? Good question.
The firm reported its second quarter financial results about a week and a half ago. Revenue of $3.52 billion was good enough for year-over-year growth of just 7.5% but also beat Wall Street. U.S.-based sales were up 8.7%. The adjusted EPS of $0.95 also beat Wall Street’s expectations. Operating cash flow ran at $360 million, resulting in a free cash flow print of $301 million.
This was the firm’s best quarter in terms of free cash flow in six years. GAAP net income landed at -$1 million, but that was only after a $59 million loss related to transaction related to debt extinguishment. For the current quarter, Wayfair guided to high-single-digit (in percentage terms) revenue growth and an adjusted EBITDA margin of 6% to 7%.
This Morning
Analyst Nikhil Devnani of Bernstein upgraded the shares of W to a “buy” rating from a “hold” while setting a target price of $125. Devnani is rated at four stars out of five by TipRanks. Over the past two years, he has a 65% success rate and has generated an average return of 19.9%.
Analyst Ronald Josey of Citigroup reiterated a “buy” rating on the shares of W while increasing his target price from $95 to $133. Josey is rated at four stars out of five by TipRanks. Over the past two years, he has a 55% success rate and has generated an average return of 16.2%.
Last Week
Sixteen sell-side analysts increased their respective target prices for W in response to those earnings. Thirteen of those analysts are rated at four stars or more by TipRanks. The average target price across those 13 highly rated analysts is now $118.23.
The Charts
There are two ways to look at this chart and the interpretations that one might draw from either take could not differ more in terms of potential outcome:
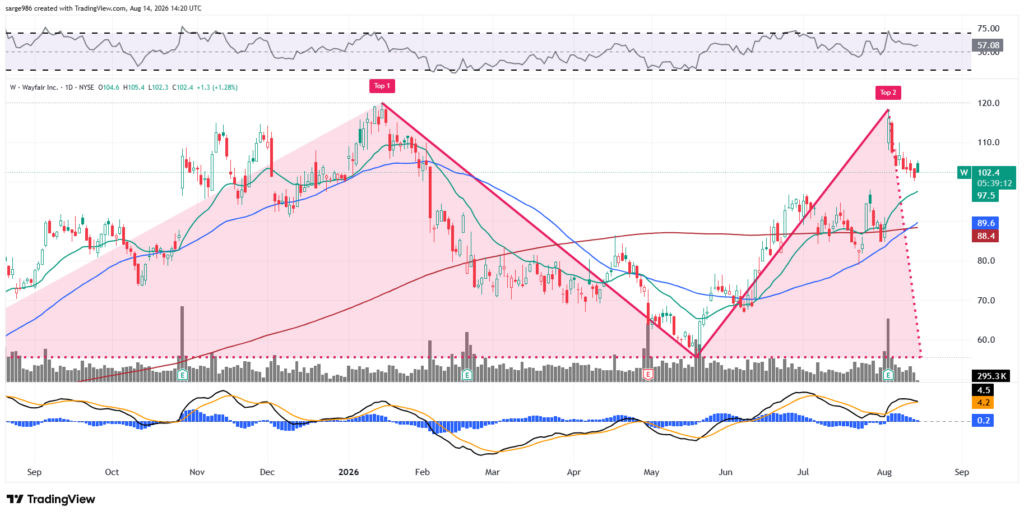
Bears would see a double-top pattern of reversal with an unfilled gap that would require a tick at $91 or lower to close. Bears would also see a MACD that shows a 12-day EMA setting up to potentially cross below the 26-day EMA. This is not an incorrect take. It’s just not my take.
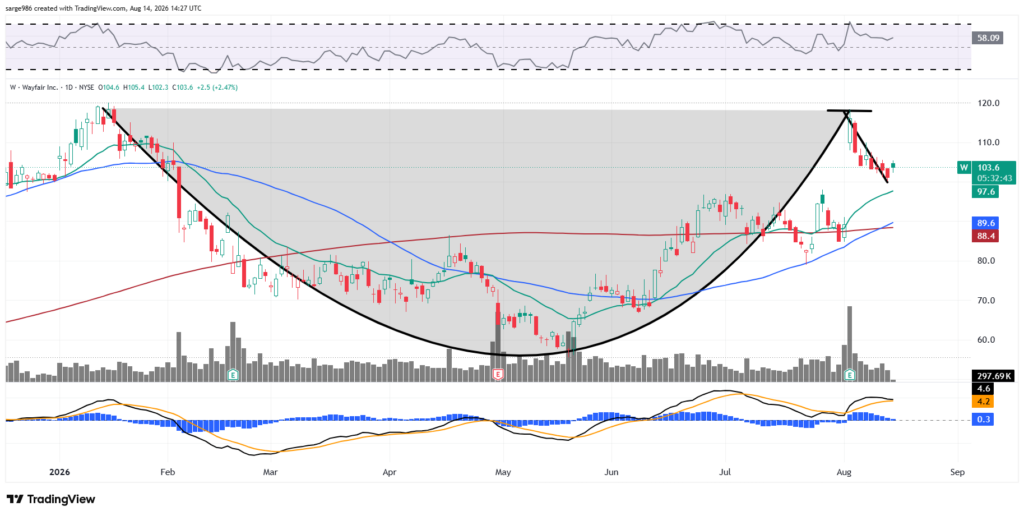
What I see is a cup-with-handle pattern of bullish continuance. Yes, I see the unfilled gap. I suppose the depth of the handle could grow from here. That said, Wayfair has just experienced a golden crossover of its 200-day SMA by its 50-day SMA, which is a bullish signal. In addition, relative strength is solid, but not technically overbought. Additionally, all three components of the daily MACD are still in positive territory and the 12-day line is still riding above the 26-day line. This stock, in my opinion, can be brought down to that 50-day line. The $118 pivot created by the cup-with-handle pattern could ultimately produce a target price above $140.
positions: none
