The Semis/Tech Trade Finally Sees a Change


We finally got a change on Thursday.
I have been noting that the semis/tech trade was in better shape than the “others.” Thus far, that has been wrong. Oh, sure, the semis and tech did just fine, but they did not do “finer” than the “others.” And the others surely haven’t gone down.
But on Thursday, folks discovered the semis are still the sort of stocks they like. They took the ($SOX) right up to the 50-day moving average line. And you have to squint to see it, but it got there and backed off. It may try it again but it’s overbought (short term) and now we have a change in sentiment as well.
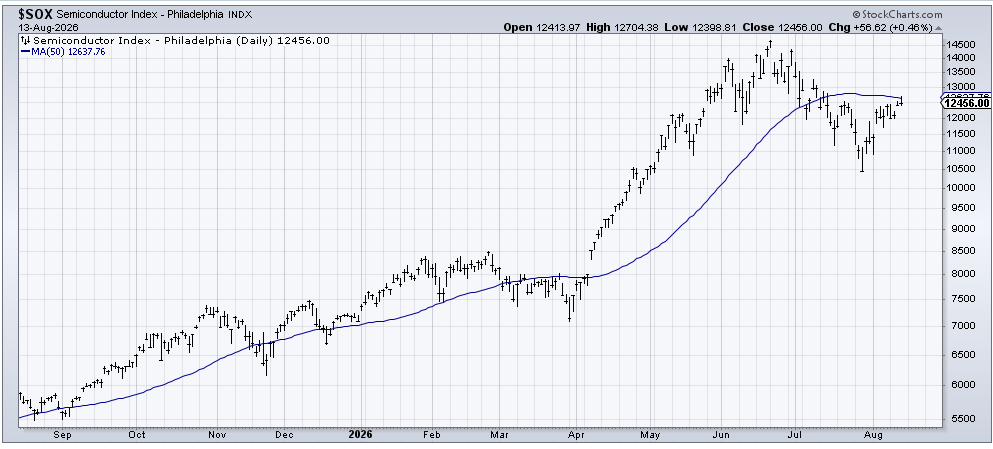
On Thursday, the ISEE Equity call/put ratio was 2.24. On its own, that is meaningless. But to put it in perspective, it is the highest reading since July 9. Now, I ask you to look at that chart of the SOX again and see July 9: That was when the SOX broke down under the 50-day moving average line. That is when these retail options players stopped loading up on calls in the semis. That changed on Thursday.
Now, before we get all excited, let me point out that we have used the five-day moving average of the ISEE Equity call/put ratio for the last few weeks (since the lows) and it has been useful because each time it had gotten down to 1.60, we’ve seen the market rally.
On Thursday, that very short-term moving average line ticked just over 2.0. Because this is such a short-term moving average line, it wouldn’t take much — a few days — to get this cranking toward the top of the page again. That’s if they stay bullish.
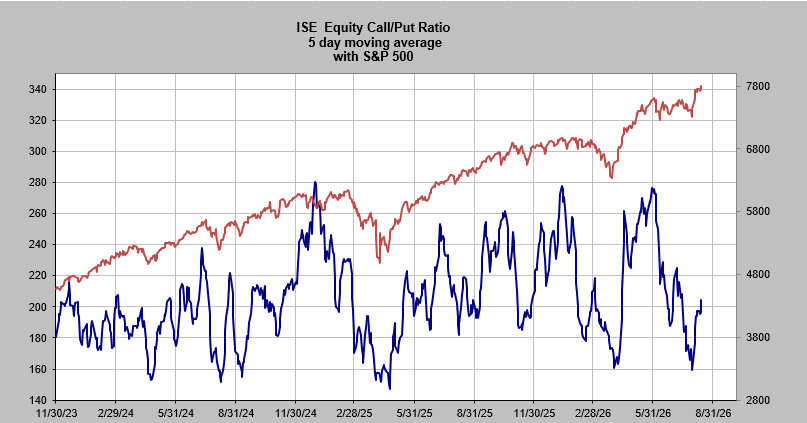
Imagine, if you will, that the Investors Intelligence bull-to-bear ratio gets over 4.0 next week. All it would take is 58% bulls (currently at 57.4%) and 14% bears (currently at 14.8%) midweek next week. That’s four trading days from now. That five-day moving average of the ISEE Equity call/put ratio could scoot right up if the call buying continues.
Now, consider that the Daily Sentiment Indicator (DSI) for the S&P is at 79. If the market can stay elevated (a big “if” with it overbought right now) between now and midweek, that DSI could easily be 85, which would be a yellow flashing light (over 90 is red flashing light). And I would think the DSI for the VIX would be a tween by then.
I know someone will surely cite the AAII survey with more bears than bulls, but I would ask how useful is that survey if it hasn’t seen the bulls over 50% in more than two years? We’ve had a 20% decline in the market and we did that without this ever getting over 50% bulls!
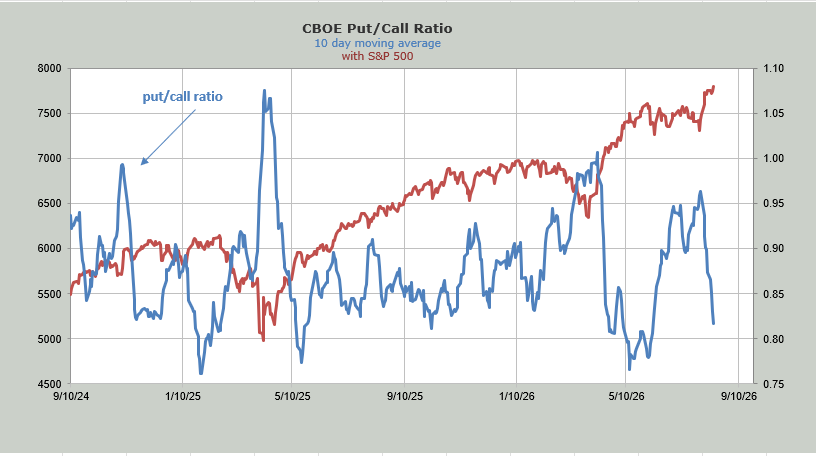
But if you need another sign that folks are mostly all in, take a look at the 10-day moving average of the put/call ratio (CBOE). It is now at .81.