Over the last six weeks I have spent a good deal of time chatting about sentiment. In early February I thought we’d reached ‘giddy’ again (more on that later). And then as the software sector and growth stocks in general began their waterfall declines I harped almost daily about the options ratios.
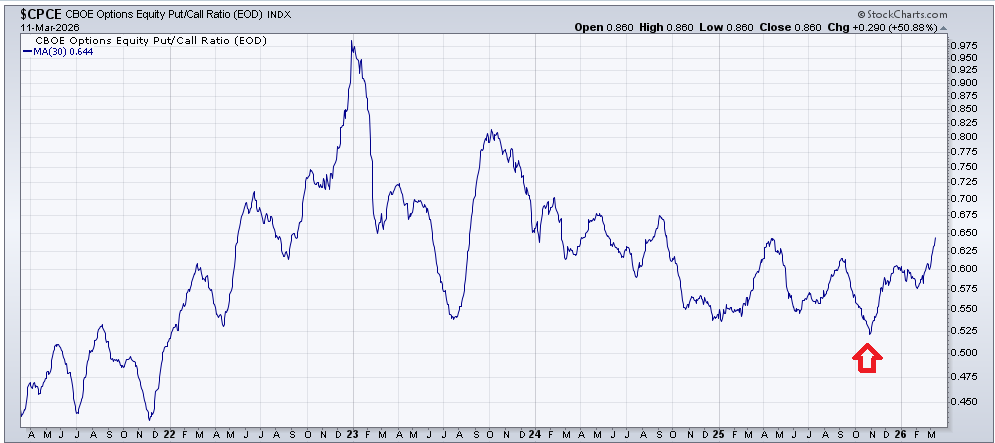
Usually I show you the 10 day moving average of the CBOE’s total and equity put/call ratio. But today I would like to show you the 30 day moving average of the equity put/call ratio. To begin with that low in October was the first sign we had of giddy sentiment (red arrow). But notice that the February giddiness did not show up in this chart. In October it fell to .52 while in February it was only .57.
But now you might have to squint to see it but it is at .64 which is where it was at the Tariff Tantrum last year.
I suspect the reason is because this time around it has been building since October where last year it was quick and the decline was over within a matter of days. Since we have not yet had a day where the equity put/call ratio skyrockets it’s probably still out there. But look at the bright side: look how high it is already!
Jason Meshnick, CMT, is the CEO of TheStreet Pro. Jason also started TheStreet's Filthy Rich Animal newsletter for newer investors. If you're not on the list, you can click here to subscribe.
Jason has over 30 years of industry experience across Wall Street, Fintech, university-level teaching, and financial journalism.
20 Years in Fintech
Before joining TheStreet, Jason spent nearly 20 years in FinTech, developing dynamically generated AI investment analyses. His work was available at Schwab, TD Ameritrade, Fidelity, ETrade, and nearly every major online broker in the US and Canada. However, his real passion arose when he was asked to write a weekly educational investing newsletter for his coworkers. Topics included why vampires are so rich and what car racing can teach you about investing. These have been republished in Filthy Rich Animal. Learning about investing should be fun!
Jason created the Fear & Greed Index for CNN Business. Although he jokes that it's his claim to no fame (it's famous, he's not), the model for understanding investor behavior has become incredibly popular and is used by everyone from hedge funds to individual investors.
Lecturing at the University Level
Teaching his coworkers led to a role at CU Boulder, where Jason taught classes in Investments and Corporate Finance. He's no longer teaching full-semester classes but continues to lecture on technical analysis and other investing topics.
10 Years of Wall Street Trading Experience
Jason spent a decade working on Wall Street as a trader and market maker, where he learned all about market microstructure and investor psychology. During his first five years on the Street, he traded mostly closed-end funds and utility stocks. Later, as a market maker, he managed large caps like ExxonMobil, Texas Instruments, Disney, American Express, and Wells Fargo.
When Not Thinking About Markets
Jason’s other passion is cars. He earned the distinction of being the slowest SCCA road racing champion in recent history when he won his region's Spec Miata class despite having never led a race. Jason knows more about old sports cars than anybody has any right to and is always energized by a drive in his classic Porsche 911.
He is Editor-at-Large for Autoblog, and his writing on cars can be found here.
Jason is also a passionate skier. He taught skiing at Vermont's Mount Snow for six seasons when he was younger. While Jason lives in Colorado he prefers Utah's fluffier snow.
Jason spends his spare time with his wife in Boulder, Colorado, and frequently visits his kids in college.