I previously suggested not buying on last week’s EPS beat and increase in forward guidance at Meta ($META) — based, in part, by my projection that the company would announce a large equity raise.
I should have shorted the stock at that time because the shares reversed violently that day and have continued their descent in recent trading sessions!
This morning Meta announced a massive equity offering to fund their AI ambitions:
The company launched public offerings of about $35 billion in common stock and convertible preferred stock. It also said it plans to launch a separate at-the-market share sale program of up to $60 billion after its new non-voting Class C shares begin trading, which is expected in the first quarter of 2027.
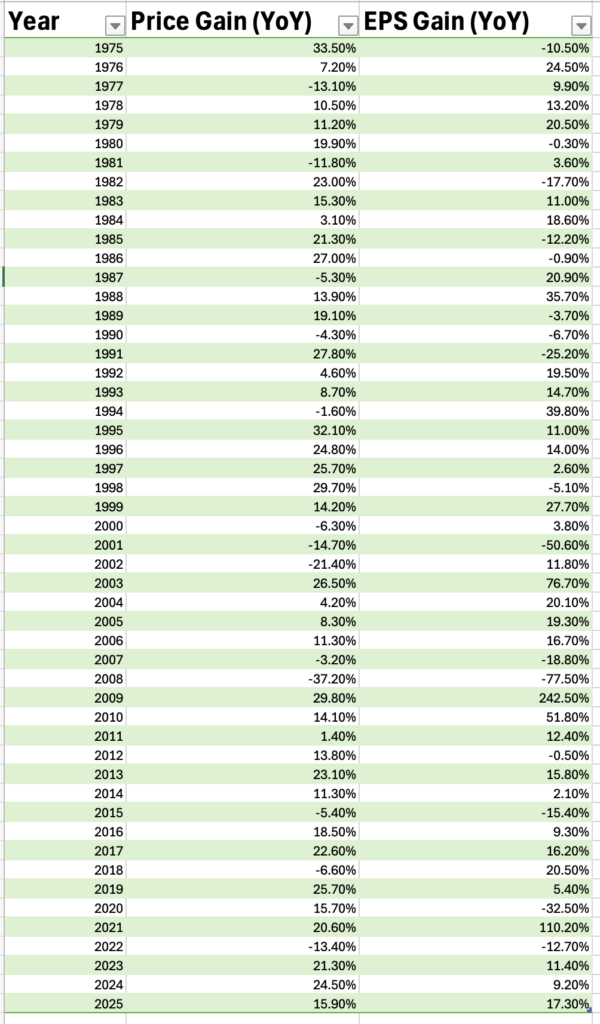
Another foundational part of her bullish market view was rising S and P profits – well that one doesn’t hold up either as 1. EPS estimates have peaked, 2. the market is looking thru the numbers because of the disproportionate role of MU and NVDA and the other AI related companies (Non recurring profits from unrealized gains of investments, double and triple ordering (they are over earning) and 3. the market is declining in the face of past strong profits. (See analysis of S and P profits to S and P prices below).
Shouldn’t Slink be push backed and be confronted with the changing facts? Or should she be allowed to spew memorized sound bytes that are taken from the rear view mirror?
“Investment vision is always 20/20 when viewed in the rear view mirror.”
– Warren Buffett
Dougie
P.S. Please read my debunking of Stephanie Link’s fundamental view that S and P prices “always” correlate with rising S and P profits:
Debunking the Core Bullish Argument That Strong EPS Equates to Strong Price Gains
The investment mosaic is far more complicated than suggested by hosts, investment strategists, panelists and guests in the business media.
First-Level Thinking Vs Second-Level Thinking
Specifically, many distill the bullish argument to this: Since 2026 S&P EPS is expected to be about +20% (well above consensus expectations at the beginning of the year), the S&P price gains in 2026 should be about in line with that profit growth (or better). Candidly, that sort of distillation is the essence of “first-level thinking.”
First-level thinking is lazy, simplistic and superficial — it looks for simple formulas and easy answers. To paraphrase Howard Marks:
First-level thinking says, “S&P EPS growth will be strong, let’s buy the market.”
Second-level thinking says, “S&P EPS growth will be strong, but everyone knows it. Stocks are fairly or overpriced, let’s sell the market.”
Most recent examples of when S&P EPS was better than expected and strong were in 2018 (+20.5% EPS growth, -6.6% decline in the S&P), 2006 (+16.7% EPS growth, +11.3% rise in the S&P), 2005 (+19.3% EPS growth, +8.8% rise in the S&P) and 2004 (+20.1% EPS growth, +4.2% rise in the S&P).
Going back, during the last 50 years — other 12-month periods with robust EPS growth and less-than-stellar to down S&P price include the years 1993, 1992, 1987, 1984, 1979 and others.
S&P 500 Index
Source: Seabreeze Partners
Furthermore, I would argue that the backdrop of 2026-2027 offers unique market challenges relative to prior periods since 1975 (“it’s different this time”):
* High and rising inflation and interest rates.
* A burgeoning deficit and U.S. debtload may be a permanent condition giving the general lack of discipline from both parties in Washington DC.
* Improvisational geopolitical and fiscal policies that present threats to political and economic stability.
* Both parties are moving to extremes — the Republican party more to the right and the Democratic party to the left. With a possible Democratic congressional majority win in November, anti-corporate policy (higher corporate taxes, etc.) may be in the offing.
* Traditional valuation metrics in the 98%-tile and two standard deviations above the average.
* The AI capital spending spree and gains from investments have inflated S&P profit reports — as noted in my “More Tales From Nvidia” series an earnings reckoning may lie in the not too distant future.
Bottom Line
Looking at any one variable (e.g. S&P EPS growth) to forecast S&P price is fatuous, simplistic, lazy and is contradicted by past investment returns data.
Stated simply, the correlation between S&P EPS growth and S&P price gains is a crutch and is not a reliable indicator.
Historically, elevated consensus long-term earnings growth rates have been a contrarian indicator.
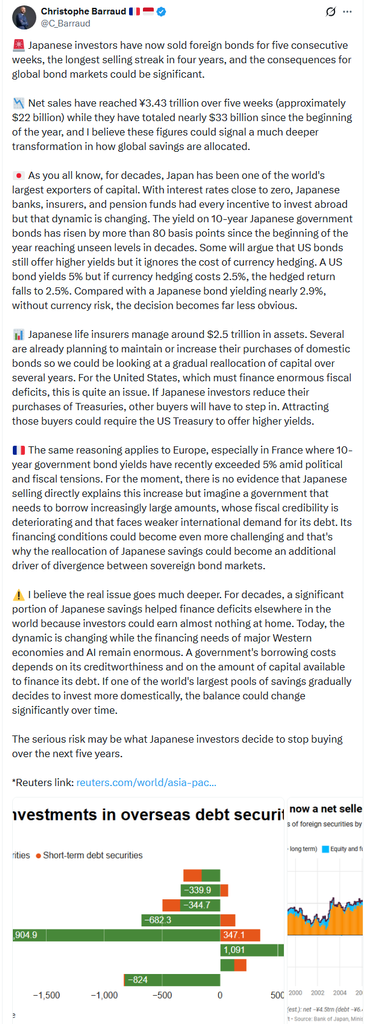
Economic analyst Christophe Barraud, Head of Discretionary Management and Research at LIOR GP, had an X post last week with his thoughts on the selling by Japanese investors in global bonds “for five consecutive weeks, the longest selling streak in four years.” [post at the bottom].
As he noted, “the consequences for global bond markets could be significant,” with Japanese yields now trading above US equivalents once hedging costs are taken into account.
“Japanese life insurers manage around $2.5 trillion in assets. Several are already planning to maintain or increase their purchases of domestic bonds so we could be looking at a gradual reallocation of capital over several years.”
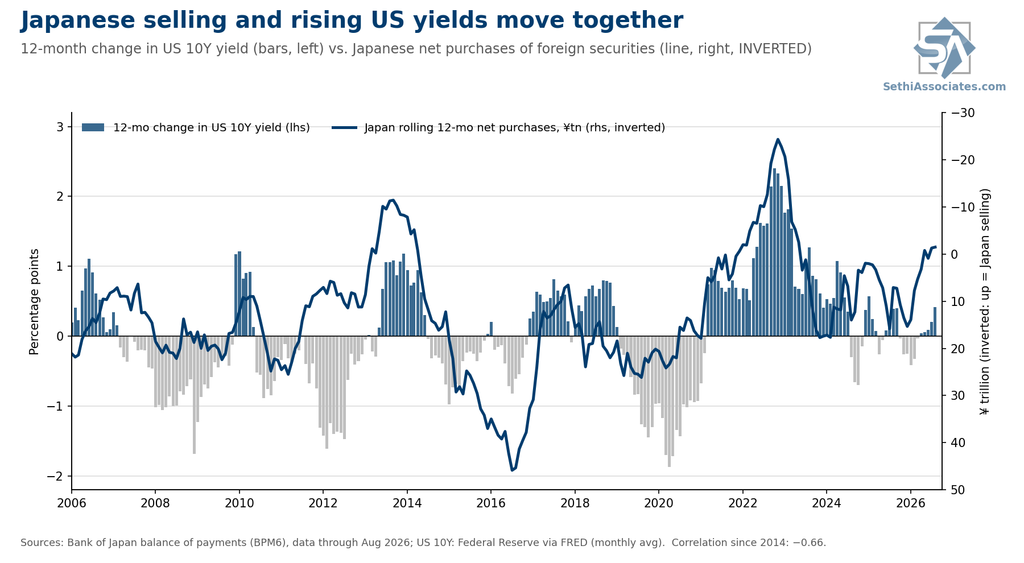
Given that backdrop, I had Claude do an analysis of how Japan’s flows line up with US 10-year yields, using Bank of Japan data on Japanese net purchases of foreign securities. Its takeaways were consistent with the risk Christophe flagged:
1. Japan flows do have a strong correlation with the change in 10-year yields. Comparing rolling 12-month net purchases to the 12-month change in the US 10Y results in a correlation of about −0.66 since 2014. That is consistent with Japanese selling driving yields. The 2013 taper tantrum and 2022 stand out.
2. Neither series, though, conclusively leads the other; the fit is tightest when both are measured over the same period. So while that’s consistent with Japanese selling pushing yields up (which makes a lot of sense), it is equally consistent with sharp rises/drops in yields and hedging costs pushing/pulling Japanese investors out/in. In 2022, the cost of hedging dollars back into yen went from roughly 0.2% to over 4%, and Japan sold a record amount of foreign bonds.
3. Flows have little correlation with a given level of 10-year yields. The correlation between Japan’s rolling 12-month net purchases and the US 10Y level is weak: about −0.14 since 1997 and −0.4 since 2014.
So it seems the reallocation risk is very real if higher Japanese yields do pull flows back home.
"As of the past few weeks, debt markets have almost entirely shut off access to money for any company that doesn’t have substantial revenue independent of AI data centers. That means the 200+ neoclouds are going to see guppy-level death and…
At this point just ask yourself: why is $NVDA investing, at times many billions of $ in cash like in the case of $CRWV, and cutting all sorts of deals with LITERALLY every single neocloud out there instead? https://t.co/3HFmw9oqcqpic.twitter.com/xAT6uVmi8J
The 3x leveraged long semiconductor ETF, $SOXL, is down -51% from its October 6th peak.
Meanwhile, the fund recorded +$3.13 billion in inflows this week, following +$6.14 billion the previous week, bringing the two-week total to +$9.27 billion… pic.twitter.com/IAdHIM9zYo