Closing Price and Breadth Action

US Indices
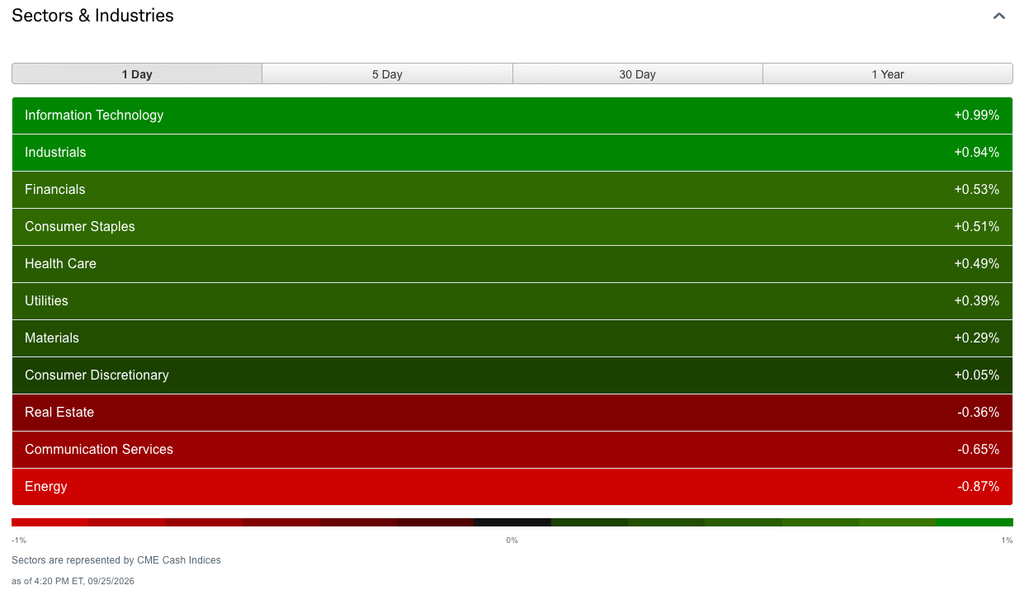
S&P Constituent Performance Today
Sector Performers
OK, maybe not the most engaging question, but I’m getting excited to be back in a race car, so bear with me.
First of all, here’s a picture of the car:

It’s a 1977 Crossle Formula Ford, running a 1.5 liter motor out of a British Ford economy car. It’s light on power, but it’s light overall, too. With me in the car, it’s about 1100 pounds. That’s about one-ton lighter than the Porsche.
Now, the Porsche still wins on power-to-weight, with about 312 hp per ton. My little Crossle has about 210 hp per ton. The Porsche will also destroy me on top speed. I’ll top out around 115 mph, while the Porsche will probably get to 140 on the straight and can hit over 190 mph on the German autobahn.
But I’m nearly as fast. I can turn a 1:58 lap time for around a 77 mph average speed, nearly as fast as the Porsche.
The answer is C!
So, let’s bring it back to investing.
The Porsche’s strength is its acceleration. The Crossle’s strength is its cornering speed. Basically, I can brake later and maintain a higher speed through the turn.
If you were to compare the data traces of the two cars, you’d see the Porsche’s swing up and down more violently than the Crossle’s.
It’s kind of like the volatility of a portfolio. You want your portfolio to have fewer ups and downs and just get on with making money. The lesson is that risk matters. You can build a portfolio that is lower risk and offers similar returns to one that is higher risk; plus, you’re just more likely to meet your goals with the lower volatility one.
Tomorrow, I’m going to be participating in a vintage race at our local track. I won’t tell you the car (yet), but it’s got a 1.5 liter 4-cylinder engine. It will be on racing tires (slicks), however.
This is the prior generation of Porsche 911 GT3 RS. It’s got 4 times the horsepower of my little car and a big wing to create lots of downforce. It’s also got a price tag well into the 6 figures. Yes, I want one.

That car set a record time around High Plains Raceway of 1:56.88, which corresponds to an average speed of 78.54 mph.
About how fast can I expect my little 4-cylinder car to go around the same track tomorrow?
In my last job, I did some work with the CDS team at what was then called Markit (now S&P Global). They’re smarter than me, but I learned that when a CDS chart points upwards, that’s bad. Up bad. Down good.
Why? CDS (Credit Default Swaps) are insurance that bondholders take out against the risk of a bond’s default. They’re an excellent indicator, and I used CDS in a model that I built that did a really nice job of predicting future stock performance.
The lesson I learned was, don’t bet against bondholders. They’re smarter than stockholders.
So, when Gavin Nolan at S&P publishes a report, I try to read it. I can’t share the report here, but you can click the image to go to his original post, where it’s available.
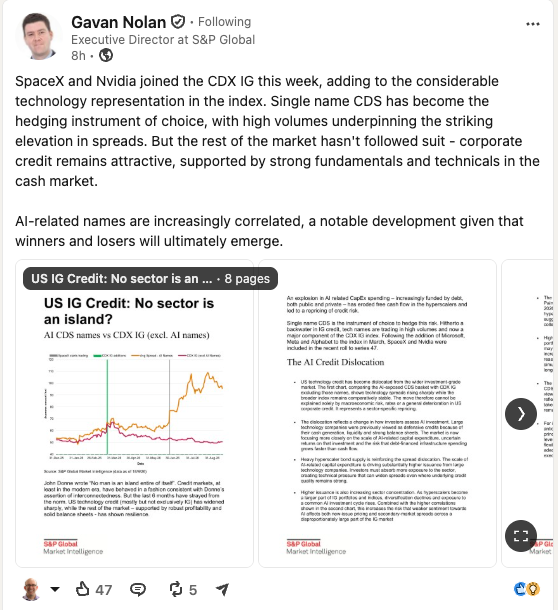
Here’s my quick summary:
Why is this important? Why listen to bondholders? Bond returns are asymmetric. If AI succeeds, bondholders get their promised cash flows. If AI stumbles, the bonds default and bondholders get what’s left, if anything. When they’re worried, you should be, too.
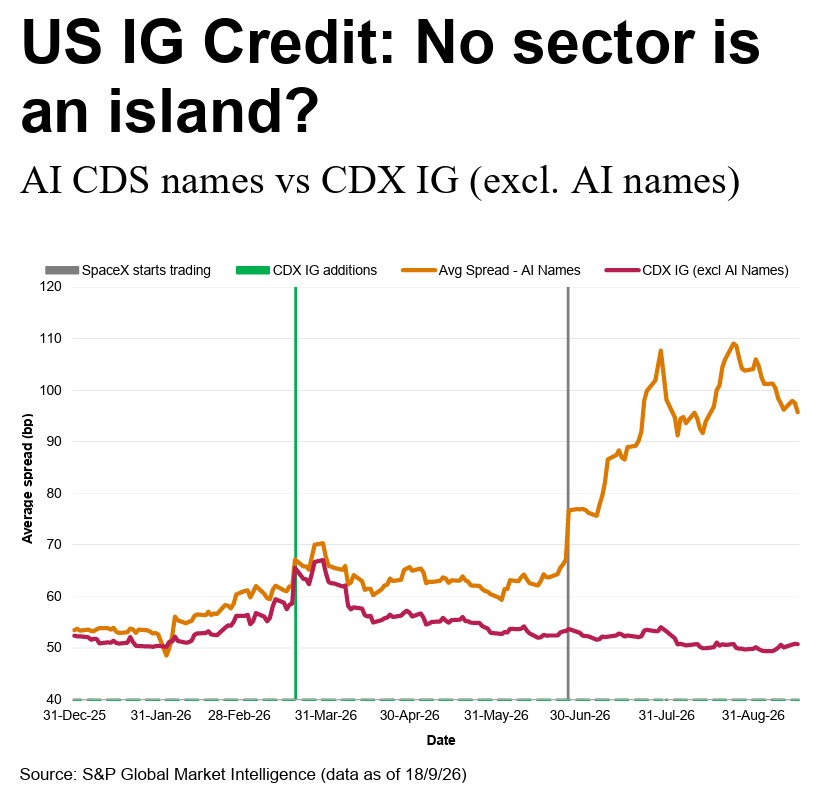
In other words, now that Artificial Intelligence is Super Intelligence, we should be super cautious.
Actually, Super Intelligence is a dumb name for something coming out of a computer. I’ll bet on human intelligence over the computer stuff any day. Humans are super. Computers are subservient (I hope). Rant over.
Final September UMich read shows consumer sentiment sinking to a four-month low as inflation expectations rise.
Like Dougie, I’m a fan of Scott Galloway’s work. Today, he writes about a topic that probably includes many of you: Everywhere Millionaires.
My takeaway from this piece is that if you believe in capitalism, support small businesses.
And TheStreet Pro just happens to be a small business! Thank you for your support.
https://www.profgmedia.com/p/the-1-next-door

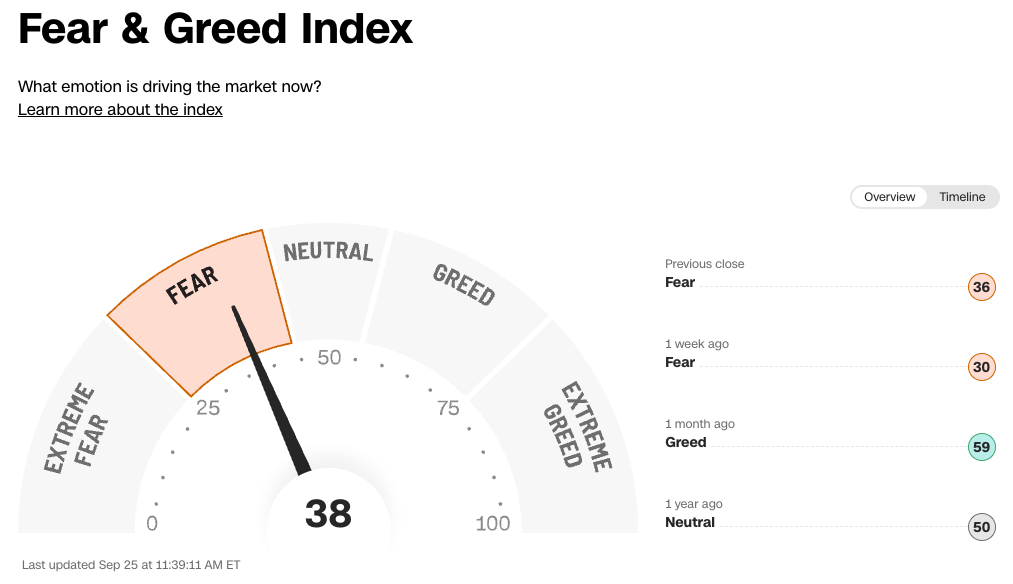
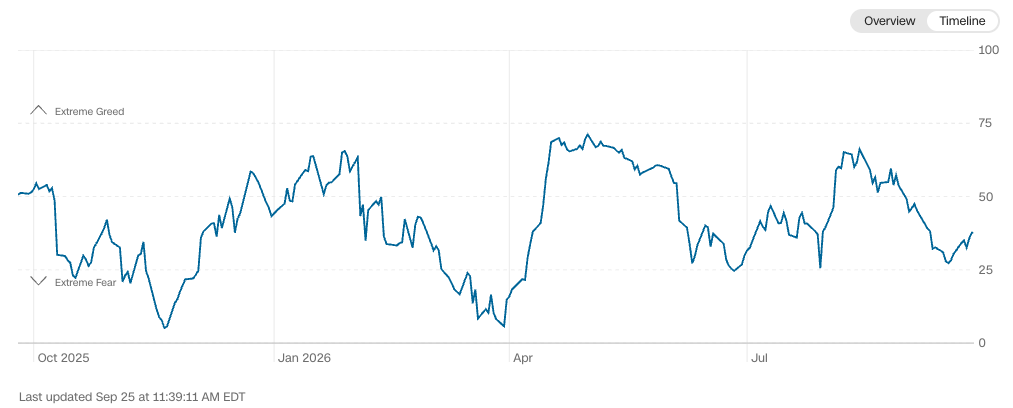
It’s been a while since I provided an update on CNN’s (mine) Fear & Greed Index. So, let’s do it!
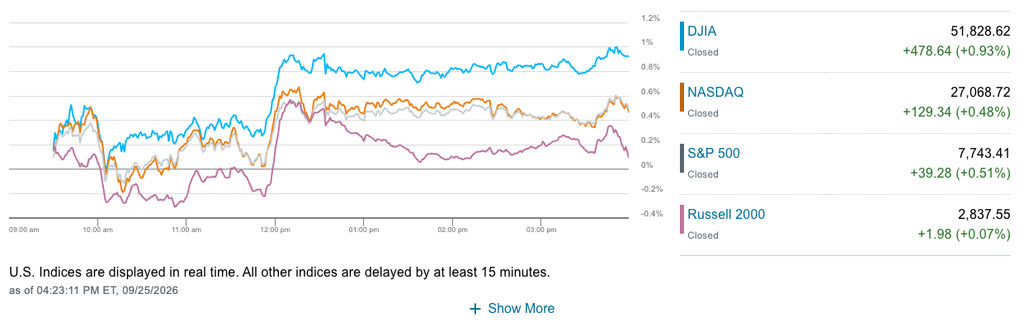
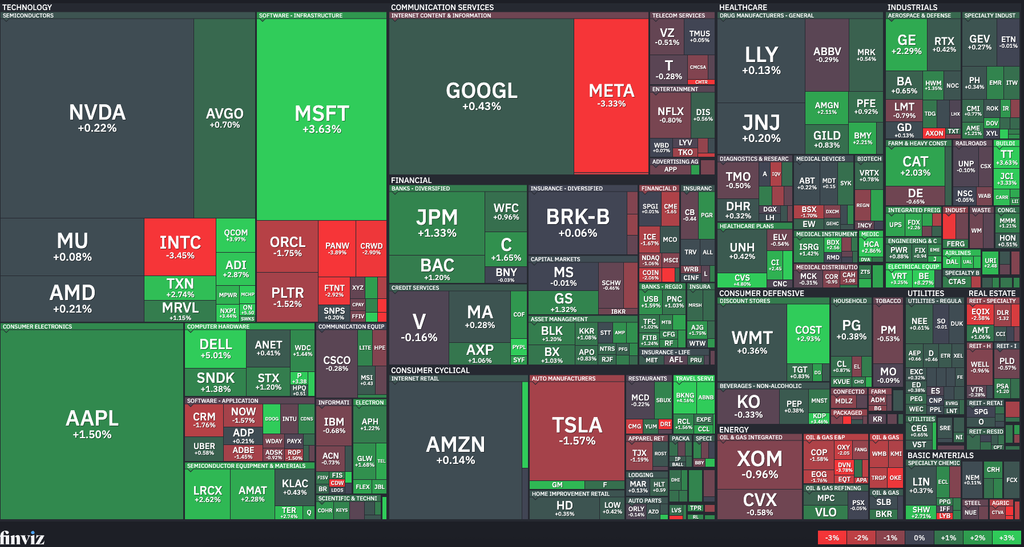
The headline number of 38 is 11 points off the low of 27 set on 9/16. The stock market is up a bit in that time, too, but are we feeling less fearful? The stocks that drove those gains are the same ones we’ve all been focused on this year, the mega-cap techs. Specifically, $NVDA, $META, & $AAPL. Not all of the big names have been participating, though. In fact, NVDA, while it did rally off the 9/16 low, is still stuck, having set its yearly high in May.
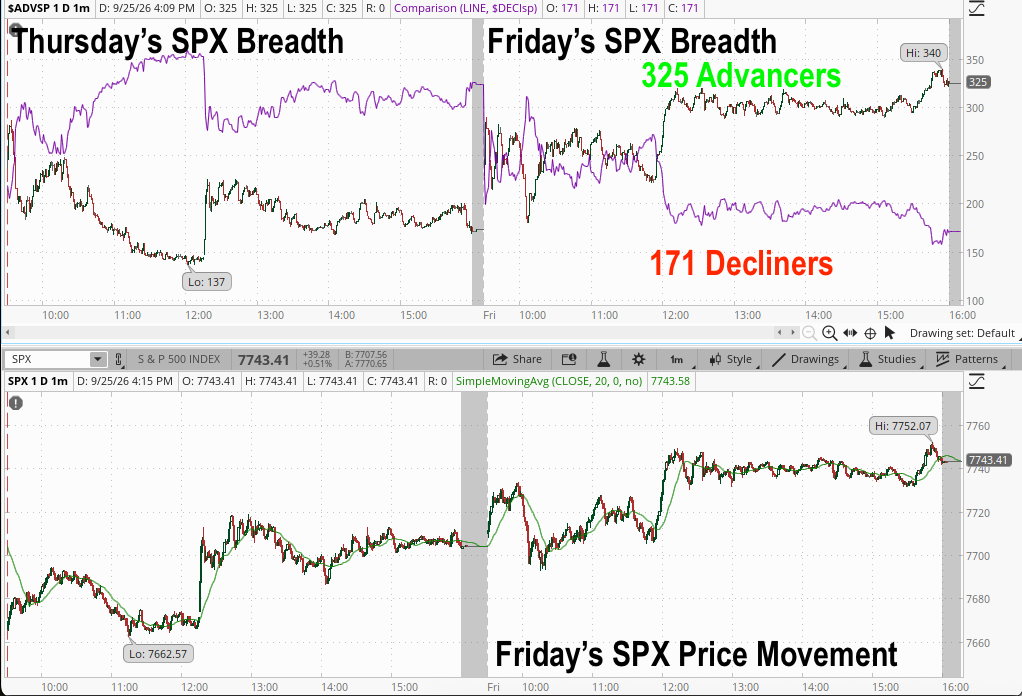
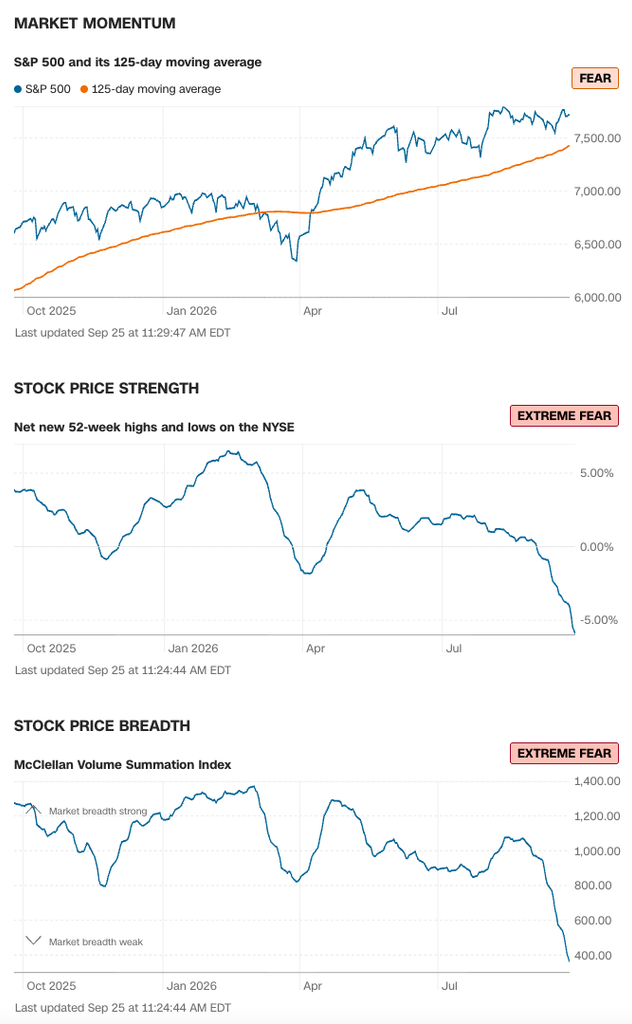
Overall, breadth remains narrow, with net new 52-week lows dominating new highs by a big margin on the NYSE. Downside volume has swamped upside volume, too. As a result, even though the S&P 500 is near all-time highs, it’s gone sideways for the last 6 weeks.
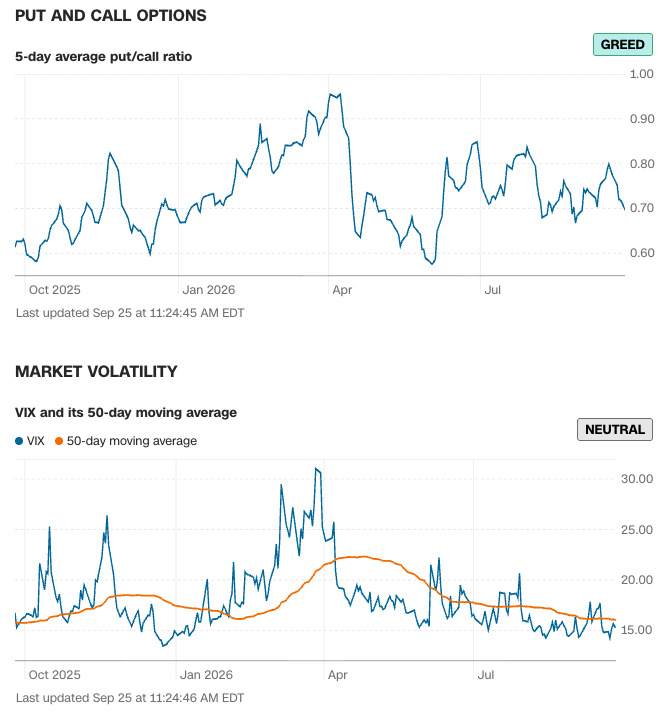
The options indicators have gone sideways and show no fear. They seem to reflect only the performance of the mega-caps and not the performance of the other 490ish stocks. $RSP is down about 6% since August, and small caps (RUT) are off 7%. Helene Meisler says that investors are getting complacent, and I don’t disagree.
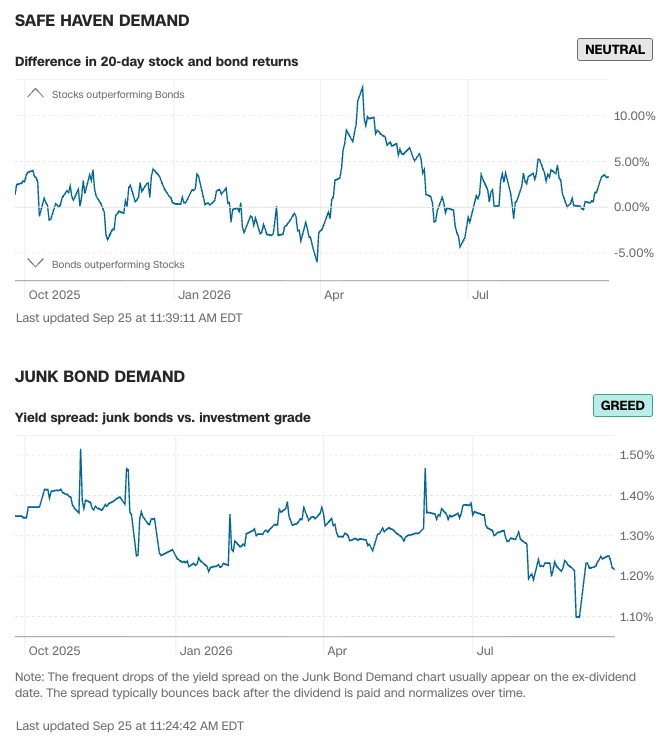
So, how are bonds doing? The Safe Haven Demand indicator includes treasuries, while the Junk Bond Demand indicator is corporate-focused, high-yield corporates ($HYG) vs. investment-grade ($LQD), so the treasury decline isn’t reflected there. What we see is that stocks are beating bonds. No surprise. Small surprise, however, is that Junk is beating Investment Grade. Not by much, and both are down, but Junk has the edge.
So, like Helene said, investors are complacent in the face of a market that is not holding up as well as the big-cap weighted indexes would have us believe.
Fear & Greed hasn’t been over 60 since last spring, and that’s my line in the sand. Until we can get above that level, stocks may rally, but it will likely be narrow and not be a healthy rally.
Bringing this back to the Diary, as Crazy1 said this morning, there could be some good tax loss harvesting opportunities this fall.
All charts are from CNN Business: https://www.cnn.com/markets/fear-and-greed
This commentary was originally posted in the Daily Diary on TheStreet Pro.
I still question this logic. Yes, the market may go higher, but what about the stocks you own? It’s a narrow rally, and the spoils go to the best stock pickers. Diversification need not apply.
Amazon sports three wide moat businesses and almost universally positive analyst coverage. So why isn’t it a buy?