October Auto Sales Slip Even as Incentives Rise

In October, automakers cut prices and still sold less. U.S. light vehicle sales fell 0.8% from September on a selling day adjusted basis to a 15.5 million seasonally adjusted annual rate, down from 16.0 million in September and short of the 15.8 million consensus. At the same time, incentives went up.
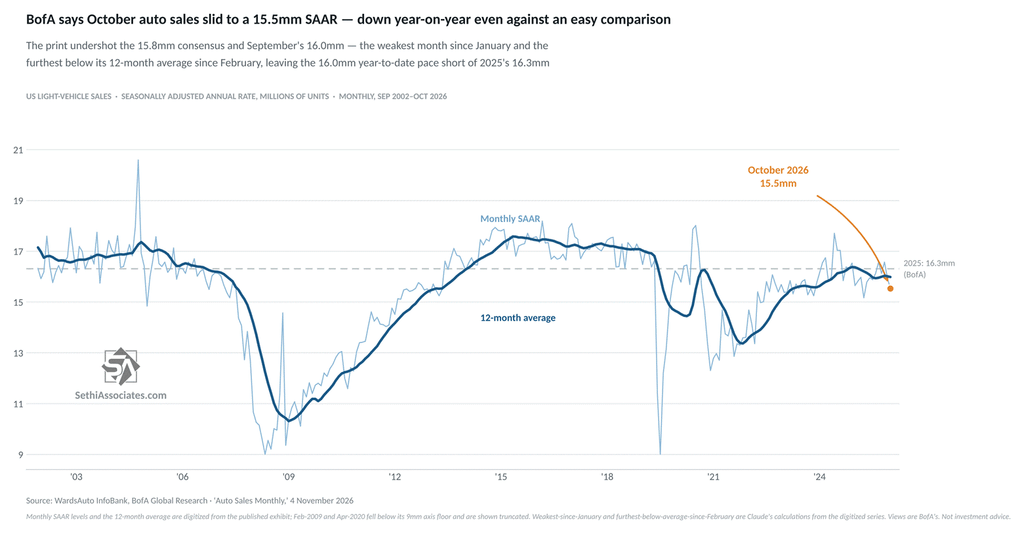
Source: WardsAuto InfoBank, BofA Global Research. Chart: Sethi Associates.
A Decline Against an Easier Comparison
Bank of America Global Research analyst Alexander Perry noted the result undershot both the firm’s own 15.9 million mid-month estimate and the 15.8 million Bloomberg consensus.
He went on to say the drop reads worse than 0.8% suggests, because the bar was low. A year ago demand was light after having been pulled forward into September 2025 ahead of the expiration of electric vehicle tax credits. Perry said that makes the year-over-year decline “more notable.”
So October was the weakest selling month of 2026 other than January, even as it came against an easier comparison.
Blame Gas Prices
Perry understandably attributes the step down to “persistently elevated retail gas prices and a recent reacceleration in inflation against an already constrained affordability backdrop.” Gasoline was the single largest contributor to September’s retail sales gain, with pump prices near $4.50 a gallon, as I wrote in Gasoline Fuels Most of the Retail Sales Beat in September.
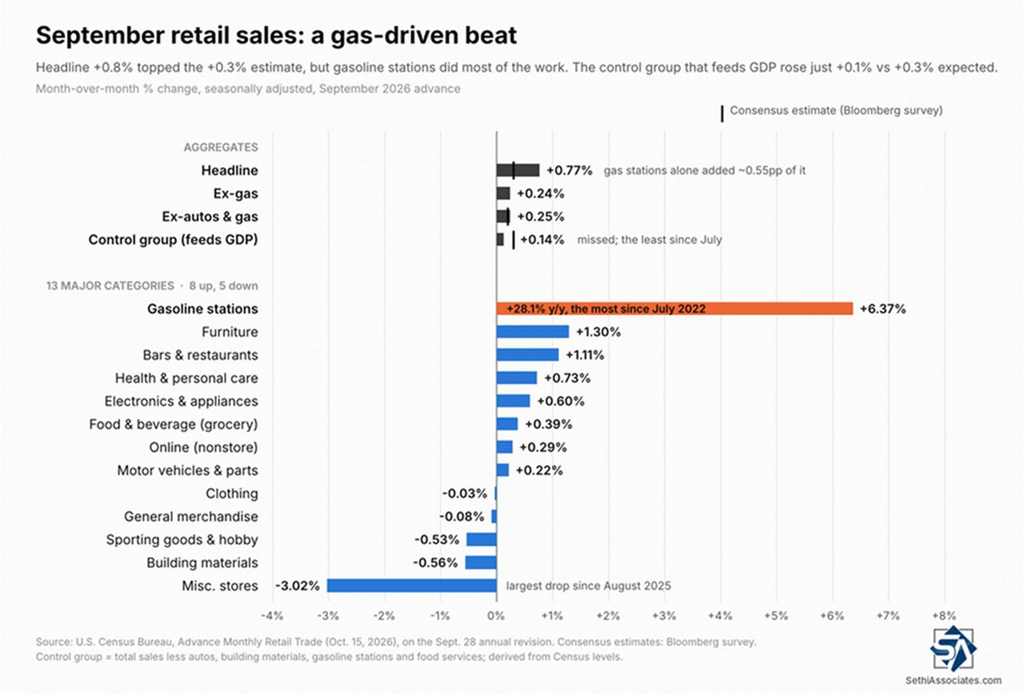
Source: U.S. Census Bureau. Chart: Sethi Associates.
The Increase in Incentives Was All Detroit
Industry average incentives rose to $3,493 a vehicle in October, up 0.6% from September, although year over year the average is still down 2.3%. But both of those headline numbers hide the same split. All of it was from the Detroit Three. Ford ($F), GM ($GM) and Stellantis ($STLA) raised incentive spending 7.3% between them. The rest of the automakers cut it.
The Detroit Three raised incentive spending to $4,132 a vehicle. Everyone else cut it an estimated 3.9%, to roughly $3,122. Over the year the divide is even wider: Detroit up 13.4%, the rest of the industry down 11.6%. A year ago the two groups were spending within about $110 a vehicle of each other. They are now roughly $1,010 apart.
Getting more granular, Ford spent $4,598 a vehicle, up 16.5% from a year ago and 10.7% from September, putting it 31.6% above the industry average for the second straight month. General Motors spent $3,499, up 14.0% year over year and 15.3% from September, as it works down 2026 model year inventory. Stellantis remains the heaviest spender at $4,788, up 10.0% year over year though down 5.2% from September, and has moved closer to the pack at 37.1% above average from 50.3% the month before.
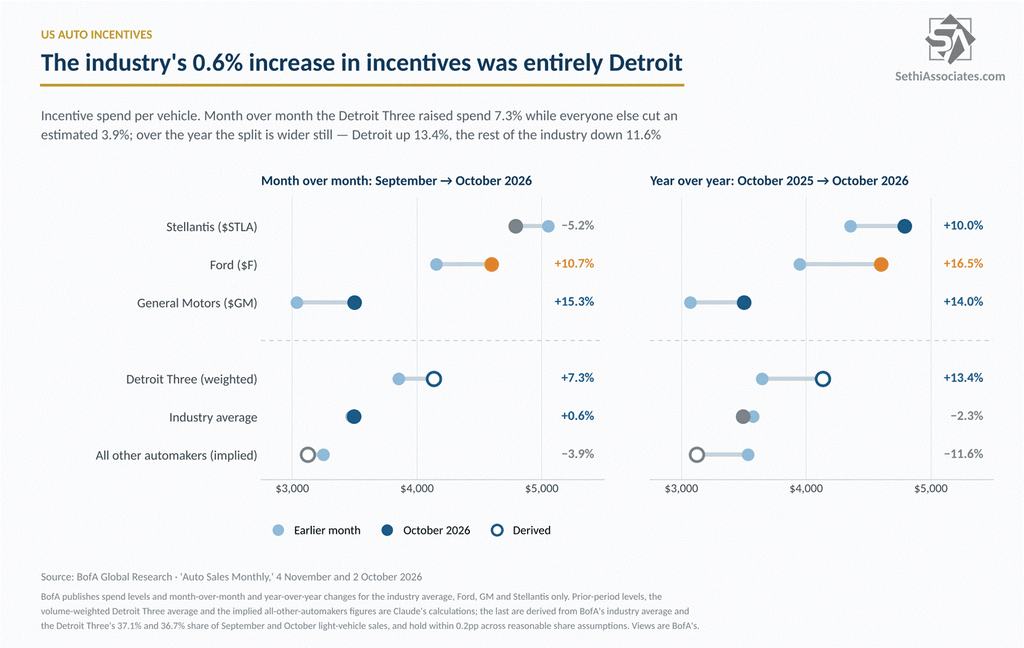
Source: BofA Global Research. Prior-period levels and the weighted and implied figures derived per Claude. Chart: Sethi Associates.
Now set that against sales. Detroit Three volumes fell 5.4% year over year and European brands fell 6.6%, while Japanese brands rose 4.2% and Korean brands rose 5.6%. So Detroit is discounting harder but still losing volume.
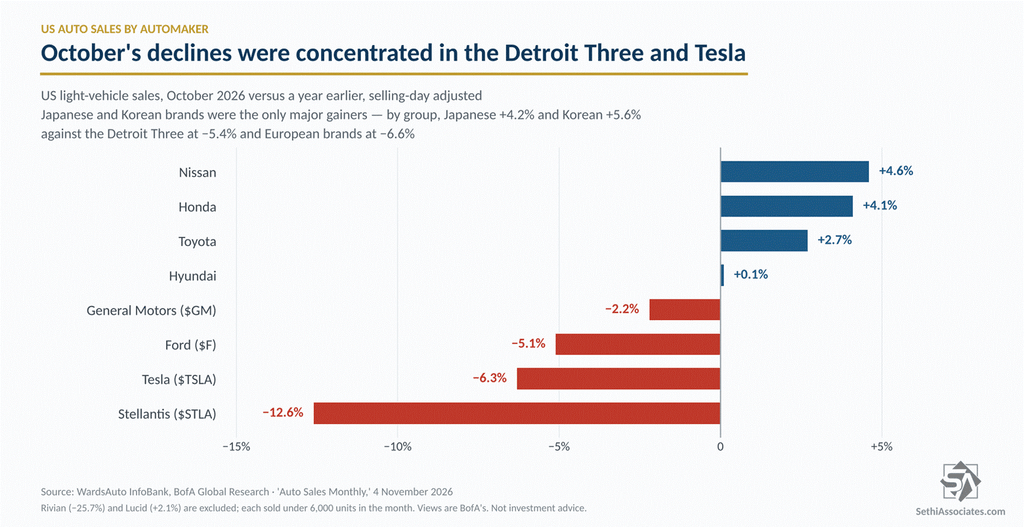
Source: WardsAuto InfoBank, BofA Global Research. Chart: Sethi Associates.
BofA Is Not Cutting Its Full-Year Estimate
Despite the soft month, Perry still sees 2026 finishing near 16.1 million, in line with where the firm started the year. The year-to-date pace stands at 16.0 million against 16.3 million in 2025.
Gas Prices Are Also Showing Up in Unit Mix
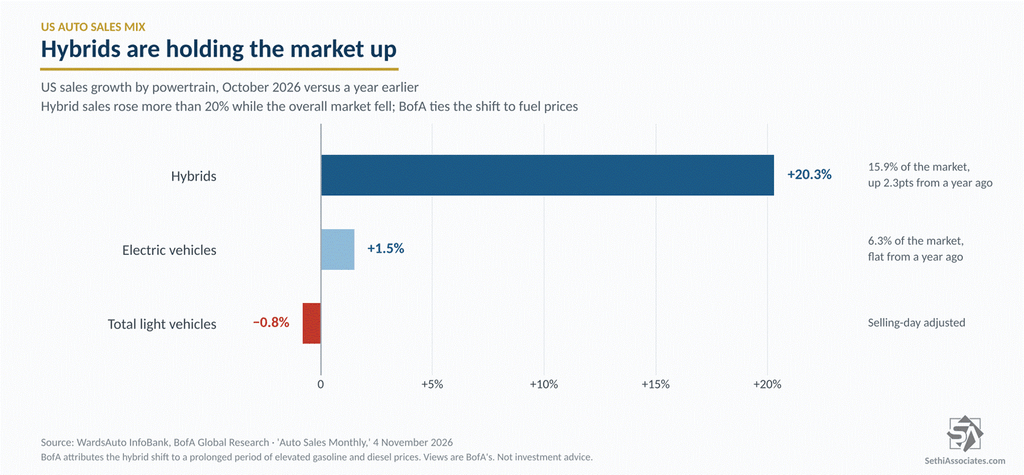
Elevated gas prices are also shifting the mix. Hybrid sales rose 20.3% year over year in October, lifting hybrid share 2.3 percentage points to 15.9%. Perry said that “may reflect consumers gravitating toward hybrids amid a prolonged period of elevated gasoline and diesel prices.”
Source: WardsAuto InfoBank, BofA Global Research. Chart: Sethi Associates.