The Others Catch a Bid. Is That Enough to Overcome an Overbought Market?

The Market
It was a nice relief rally in the others today, but to be fair, even in tech-land, there was very little selling all day. And yes, I saw some of the big point moves, but when you look at the charts, the selling seemed quite insignificant.
Nasdaq’s volume was essentially 50-50 today, so sure, the precious semis were down, but the selling wasn’t enough to matter. And it wasn’t enough to change the indicators.
The McClellan Summation Index is still heading down, even though breadth was positive today. The number of stocks making new lows on the NYSE contracted, but on Nasdaq, they matched/increased by a smidge vs last week.
The most positive thing I saw was once again, the Bank Index didn’t go down. That’s two days now that it has held. And despite the move in oil, the Transports have been green for three straight days. And finally, I know bonds sat there today and had no follow-through from Friday’s big move down, but the Utes bounced (this is the area I think they ought to bounce from).
Yet all that lack of selling kept the put/call ratio on the low side (.80) and the ISEE call/put ratio on the high side (1.52, with the equity reading still over 2 at 2.39).
There are many who will like to fuss over today’s action, and maybe it will mean something that the 493 stopped going down and caught a bid, but I’m of the mind that with the market intermediate term overbought, the best we can do is a chop-fest.
I am a fan of watching for pattern changes, so let’s see if the S&P, Nasdaq, Russell, and the SOX can have a green day. Why? They are all enjoying a two-day sell-off, and none of those indexes have gone to three consecutive days since the low.
New Ideas
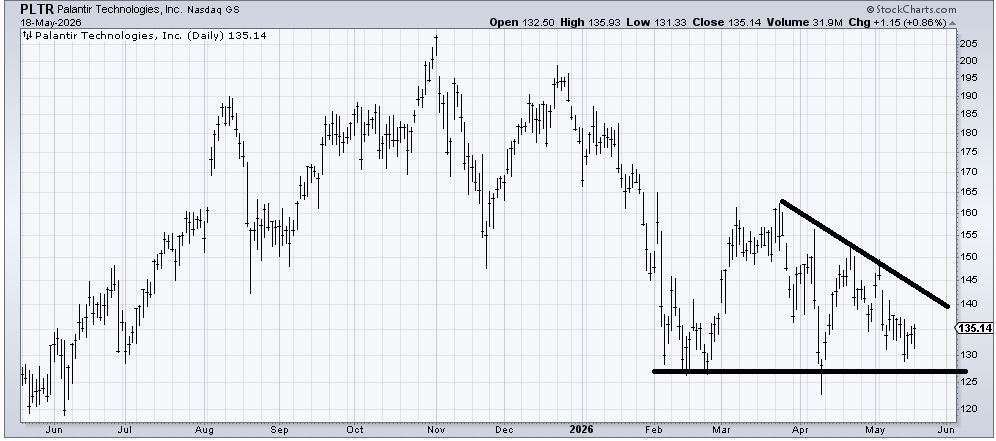
There is someone who has asked about Palantir ($PLTR) several times in the last few months, so I want to follow up, noting that it did not make a lower low on this trip down and now seems poised to enjoy another rally. Unfortunately, the stop is far away, under 125.
Today’s Indicator
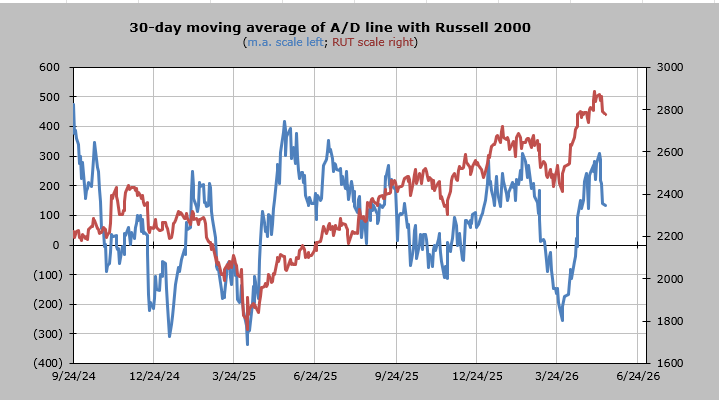
The 30-day moving average of the advance/decline line did get overbought last week (mid-May), and now we wait and see when it gets back to an oversold condition. I don’t think that means the market goes down every day, just that the upside should have little momentum. You can see (blue) how far down it has come already)
Q&A/Reader’s Feedback
Helene welcomes your questions about Top Stocks and her charting strategy and techniques. Please send an email directly to Helene with your questions. However, please remember that TheStreet.com Top Stocks is not intended to provide personalized investment advice. Email Helene here.
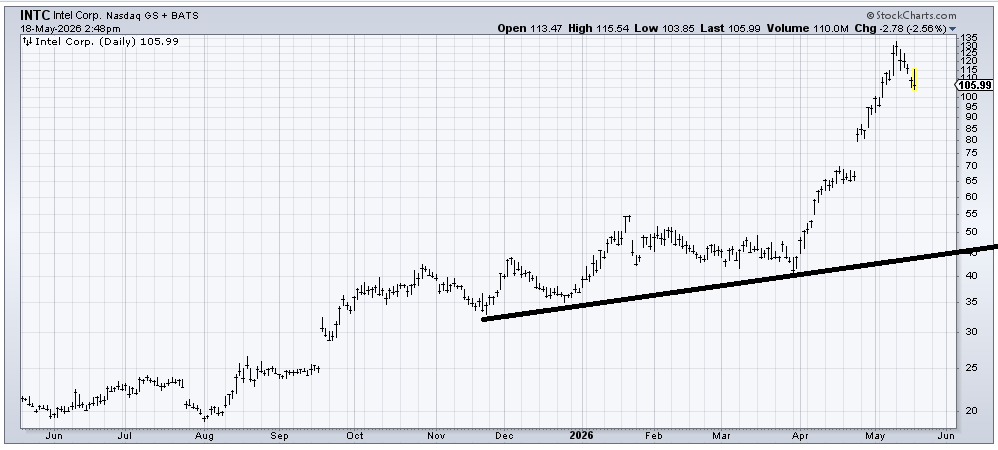
I was asked if I have a price I would buy Intel ($INTC) at, and the answer right now is I do not. I would need a pattern to set up for me to like the chart again. As a reminder, this was one of the semi stocks I thought had gone parabolic. If you want to trade it, then today is the fourth red day, and the stock is not collapsing, so it probably has a very short-term rally in the next day or so. If it can lead us to a set up like we saw in March—a giant sideways move—then I might find a reason to like it again.
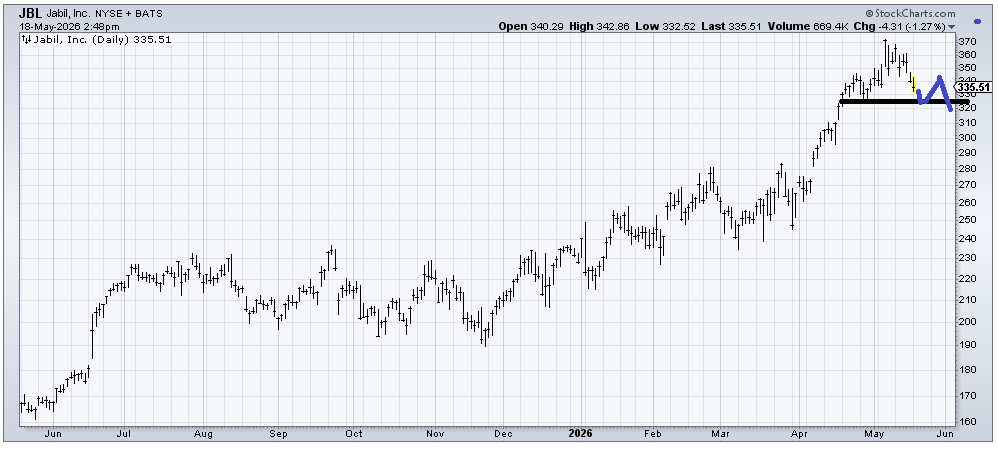
A couple of weeks ago, I highlighted Jabil ($JBL) as a stock to watch because it was only semi-related. It still hasn’t broken that 320 area. If I had to guess, it bounces off that general area, and then we look for a rally that fails and gives us a head-and-shoulders top. I have drawn in the possibility in blue.
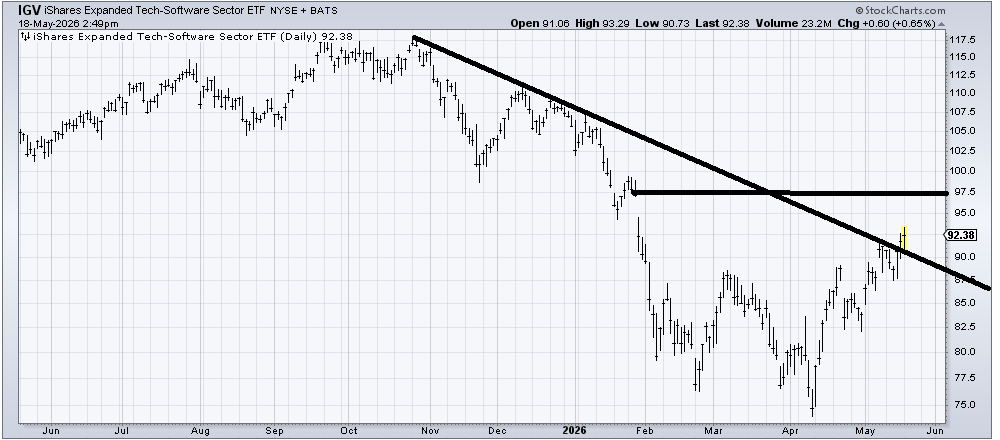
I think IGV ($IGV), an ETF to be long software, is fine; I drew in that head and shoulders bottom a few weeks ago, and not it has crossed the downtrend line. But I think in the near term it will run smack into resistance in that 95-87 area as it enters that gap.
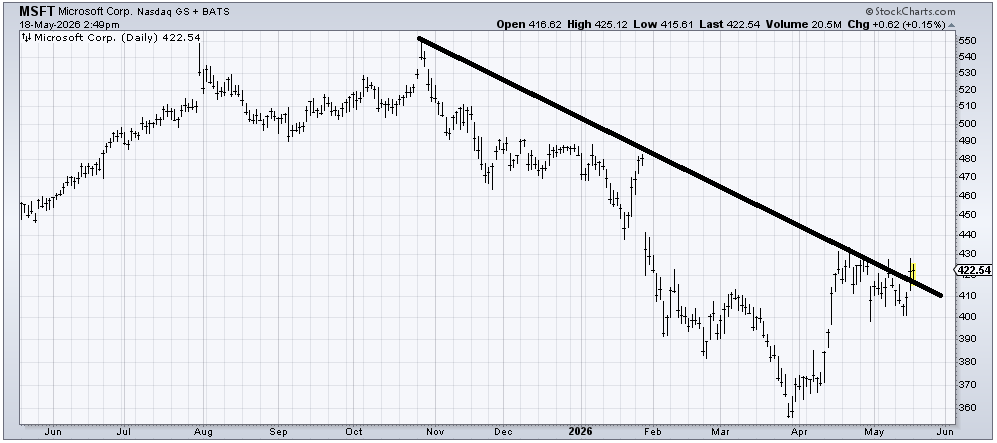
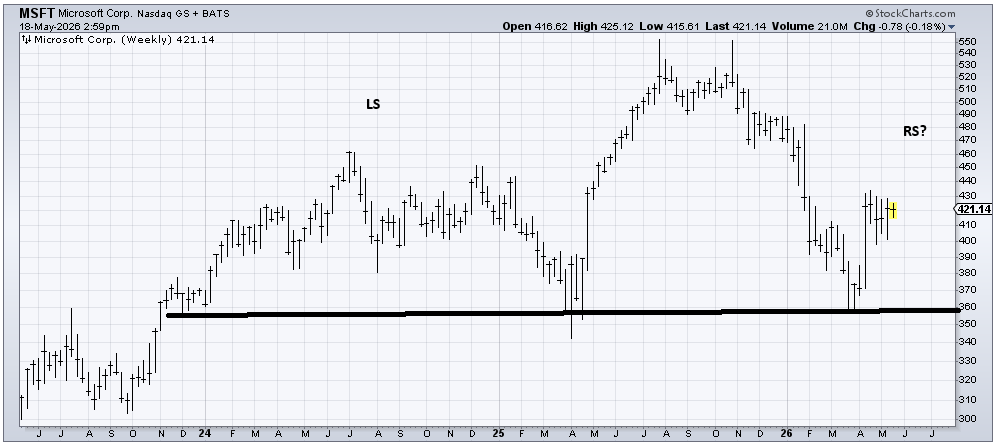
Microsoft ($MSFT), being one of the largest components of IGV, has a very similar chart. It has barely crossed the downtrend line, but I do think it can get into that gap that starts at 440. However, the question was on a long-term chart; this rally looks like the right shoulder of a head and shoulders top. If it does so, I will become quite concerned if it can’t at least get to that 440 area.