Bearish Bets: Earnings Were Not Kind to Every Stock


These three charts have big problems and they are likely only going to get bigger.
While we will not weigh in with fundamental analysis on these issues, we will pop the hood for a look at the charts.
Let’s dig in:
H.B. Fuller Has Good Support Much Lower
A range-bound stock like H.B. Fuller ($FUL) can have big swings within a range. But when there is a breakdown amid heavy turnover one has to wonder if this will be the time the stock breaks.
While that support line is rather far from the current price the technical indicators we use seem to indicate more downside is in store. In fact, an accelerated move down towards the $50 leaves the bulls vulnerable to more losses.
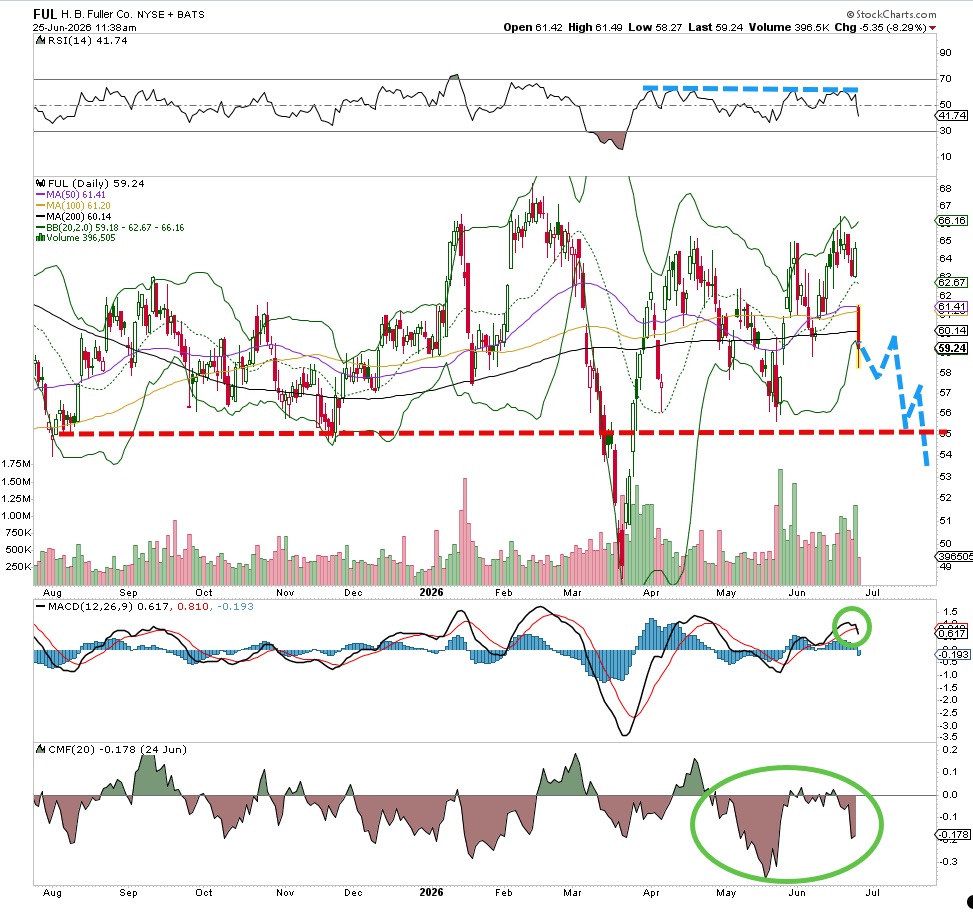
Money flow is weak, MACD (moving average convergence divergence) is rolling over for a sell signal while the RSI (relative strength index) presents a ceiling. All bearish qualities, not to mention the price action is ugly, breaking through the 200-day moving average with gusto.
Let’s target the $55 area and then perhaps as low as $50. Put a stop in at $65 just in case.
Retailer Citi Trends Needs a Lifeline
This time of year we often see good strength in retail names, and actually Citi Trends ($CTRN) had been performing remarkably well. Higher highs, higher lows on the chart signaled some interest from buyers. However, money flow was telling a different story. Further, volume trends were not bullish as CTRN was making a run higher this month, leaving the stock vulnerable to downside action.
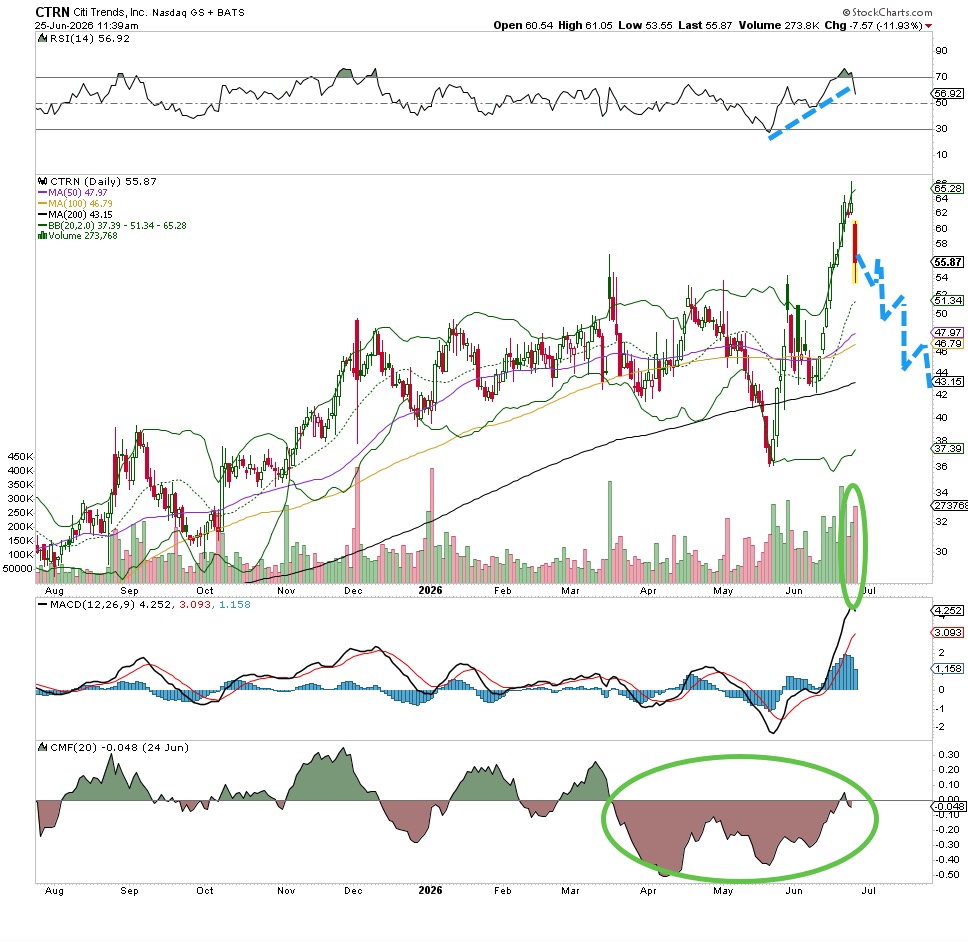
The big down bar on June 25 is problematic and only one day, which does not make a trend. Yet, we still see heavy turnover — that is big institutional selling that has hit this stock hard. RSI has come down from its lofty peak, too.
Let’s put in a target of $43 here, which is right near where the 200-day moving average lives, and then perhaps make a run down to those May lows at $36. Put in a stop at $66 just in case.
Jefferies Run Higher Has Abruptly Ended
Nothing wrong with taking profits after a strong run, but when that profit taking is accompanied by a poor earnings report, you have to wonder if there is more downside around the corner. That’s probably the case with Jefferies ($JEF), which came under attack this past week after a massive 85% run from mid-March.
What goes up eventually comes back down, and that is what we see happening to Jefferies.
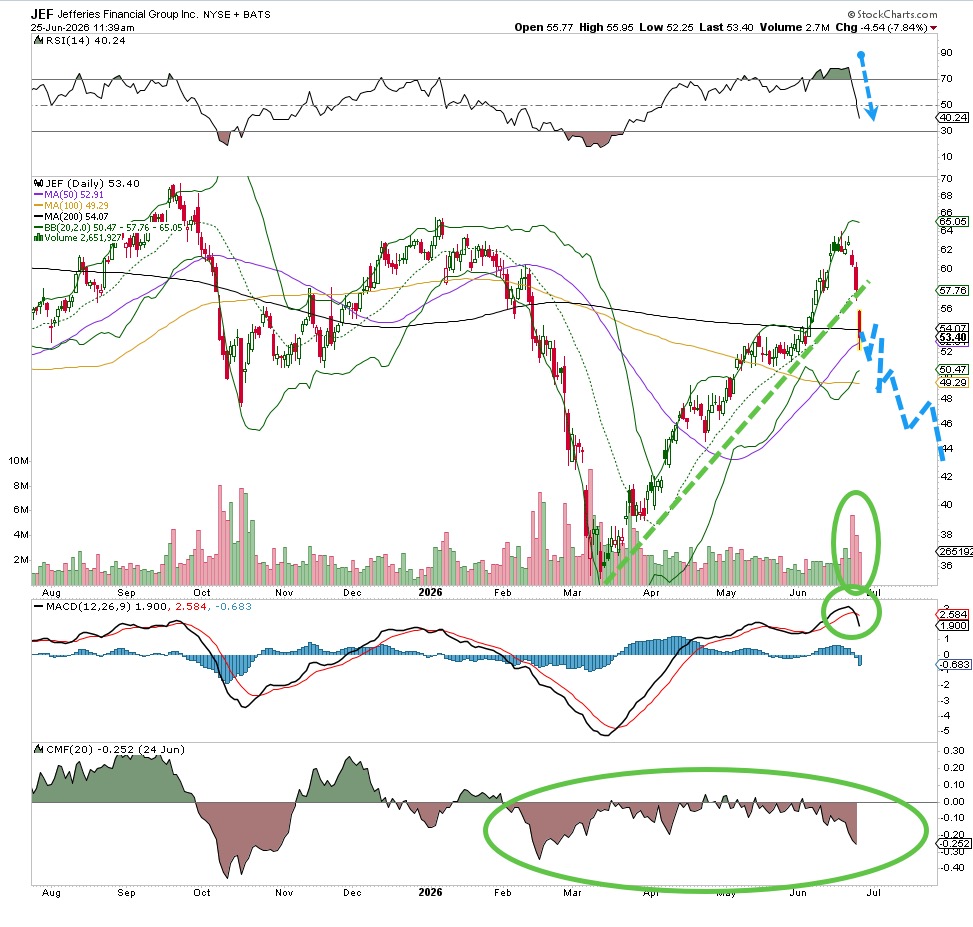
MACD is on a sell signal here, and look at the weak money flow at the bottom of the chart. Nobody is buying this stock in size. RSI has rolled over, and with another down day or two the trend will be in place.
Let’s target the $44 area, which may be good support, but if that does not hold there is that March low around $36.
