The Others Retreat While Investors Leverage Up. Something Needs to Give.


At the end of each week I jot down the closing price of the various indexes. I know a big fuss is made over whether or not an index was up or down on the week, but I am not looking for that. Rather, I am looking for a pattern.
As I look back on the last four Friday closes—so basically the month of August—I see four weeks ago the S&P closed at 7757. This past Friday, it closed at 7711. Sure, we can say it’s down, but mostly we can say there was a whole lot of nothing going on.
Yet it is in the month of August that the mantra of the market broadening out took hold. It was the non-stop narrative (and still is, although it has eased up somewhat) in the month. It has been my contention that in August, the ‘others’ would retreat, despite the broadening out chatter.
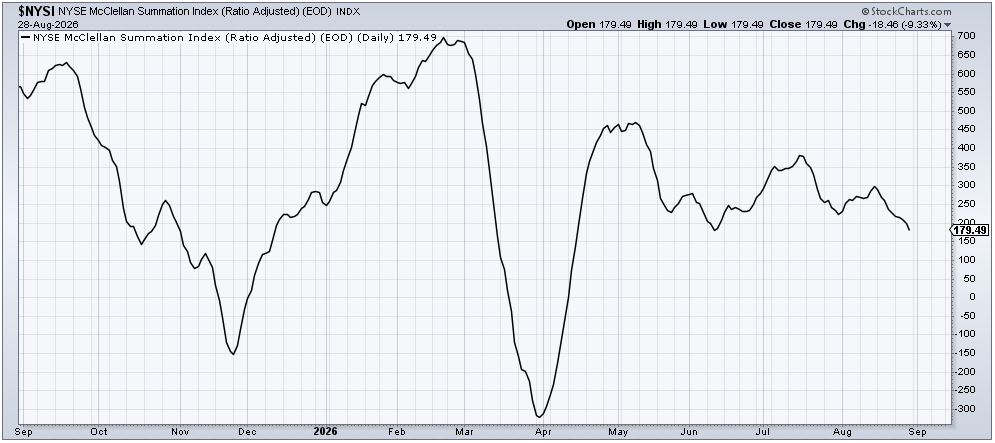
You can see the McClellan Summation Index, which never made a higher high than mid July, has been trending downward for two weeks now. It is lower than the late July low and about on par with the June low. That doesn’t look like broadening out to me.
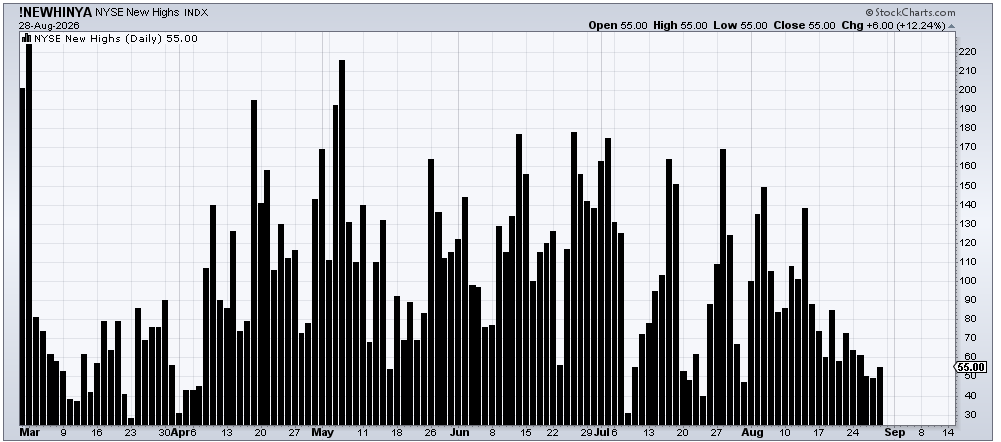
The number of stocks making new highs peaked months ago, but even if we look at late July, the NYSE logged in 170 new highs when the S&P was much lower than it is now. This chart tells me that as soon as technology/semis bottomed, new highs began contracting. A broadening rally has rising new highs, no contracting ones.
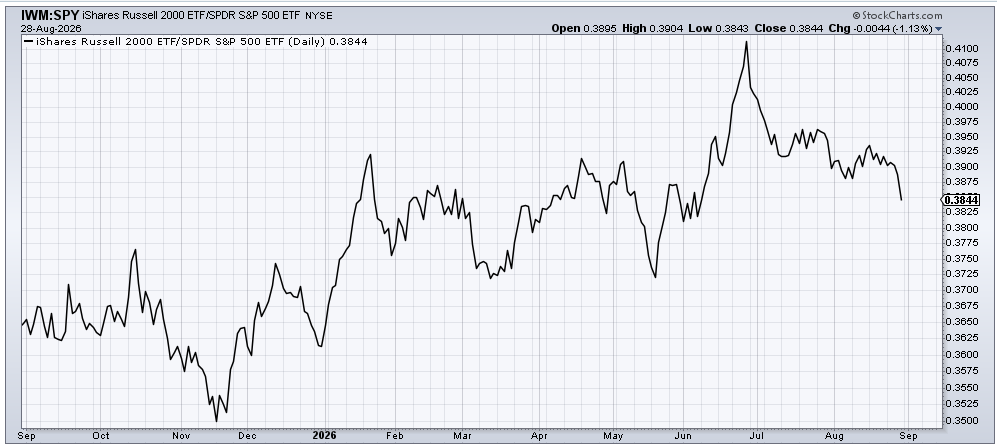
And then there is the ratio of the IWM, an ETF to be long small caps relative to the S&P. That peaked in late June, just as the Russell was rebalancing. It fell off a cliff in the last few weeks.
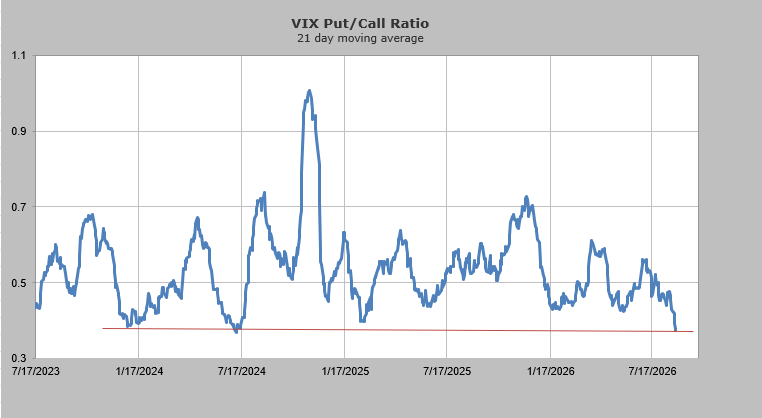
All of this selling of the others has taken place while the equity put/call ratio sunk to .39 on Thursday, the lowest reading since the waning days of May (just before the peak in the SOX/tech stocks). And it takes place while the pros seem to be getting rather persistent about buying calls in the VIX. The 21-day moving average of the put/call ratio for the VIX has collapsed in August, and in the last week, it has accelerated. Also, recall the folks at NAAIM are now on margin, something that hasn’t occurred since the summer of 2024, just before a ten percent decline in the market.
Yet since my Overbought/Oversold Oscillator is based on breadth, you can see it is getting a bit oversold.
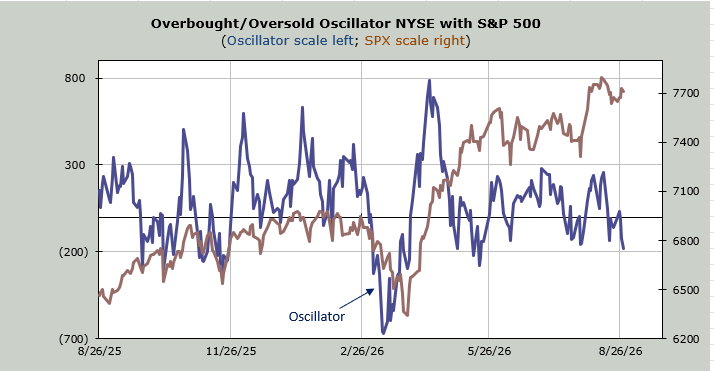
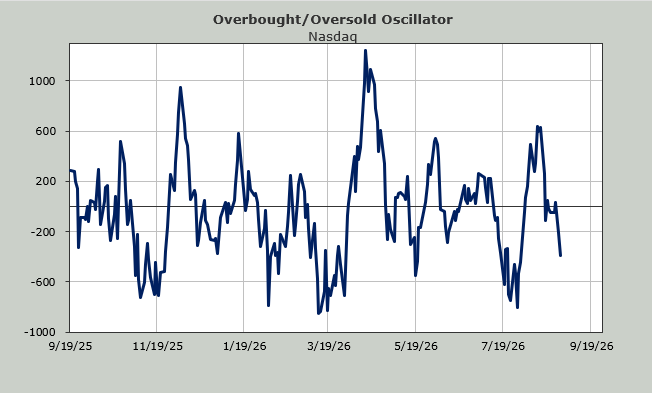
I continue to think the market needs a shake-up. It can’t seem to rally well (see those Friday closes in the month of August or the not-so-broadening out charts), and yet each time it threatens to break the selling dries right up. That has left us with a chopfest where trend traders get chopped to death. The S&P has not had back-to-back up days or down days since August 18th.
