The Nasdaq Momentum Indicator May Be More Telling Than Bonds Are Right Now


Everyone says we have to watch the bonds. Oh, don’t worry, we’re watching them closely! But their point is that if interest rates get out of hand (the rate of change!), then so will stocks.
But in the meantime, interest rates back off, and still the market just sort of churned all day. Oh sure, the semis got whacked, but everything else sat there with very little interest. I mean, when net breadth is flat, and net volume is 49% up to 49% down, what else would you call it? Even Nasdaq had 47% of the volume on the upside despite the Nasdaq Composite being down 200 points.
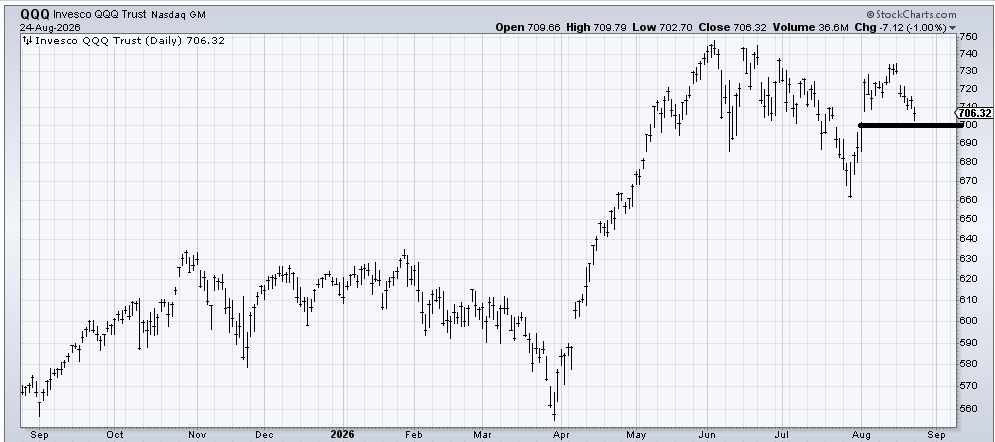
In the meantime, the QQQs are down three percent in a week, and everyone shrugs. So I’m not quite sure what they mean when they say ‘watch the bonds’. Clearly, these mega-cap growth/tech stocks care about the bonds.
The QQQs fill a gap at 700 if they get down there.
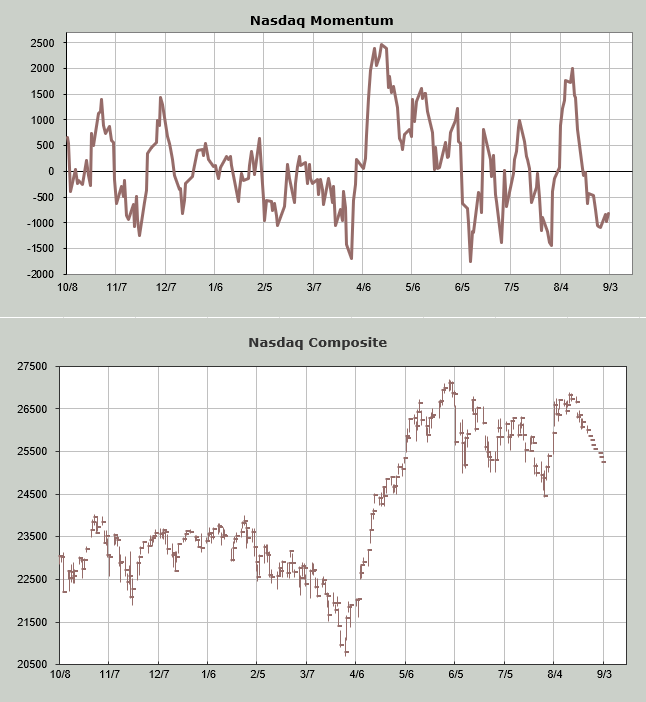
I will be watching the Nasdaq Momentum Indicator because what I have done is walk Nasdaq down another 800 points over the next week, and you can see at the end of this week, the Momentum Indicator stops going down and starts ticking up. I would say that means you want a whack between now and then because that might change sentiment from complacent to concerned.
You see, if the QQQs are already down 3% and they get a decent whack between now and the end of the week (and yes, I know NVDA reports earnings Wednesday), you can imagine all those ‘you gotta watch the bonds’ folks will become very concerned about tech stocks.
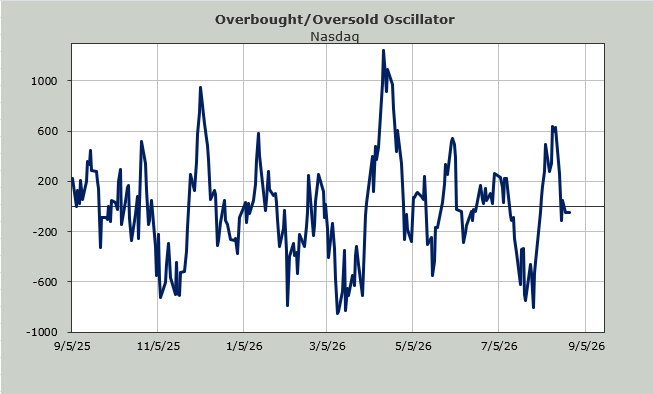
Even if we don’t get a whack—or wait, nowadays folks call it a clearing event!—Nasdaq is heading toward a short-term oversold condition near the end of the week. As always, this is not meant to pick the exact day, just a general time frame.
A few days of negative breadth on the Nasdaq would take my own Overbought/Oversold Oscillator down into an oversold condition as well.
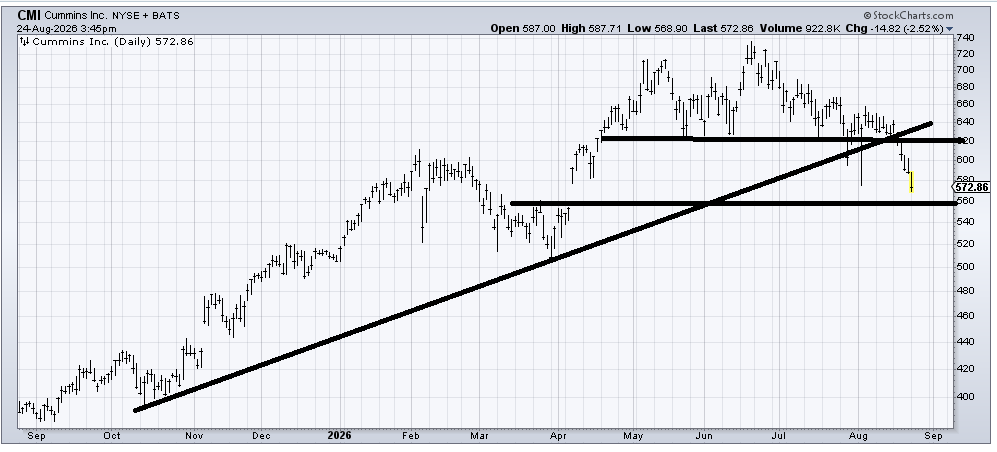
Last week, I noted the industrials had not been trading well. Then Monday, I noticed Cummins ($CMI) had come down 15%. Apparently, this has been a play on data center buildouts. There is a gap to fill around 560, and it must be getting oversold, but this should be a reminder that if you think the AI/data center trade, which has been lifting the economy for the last few years, won’t have any spillover effects, this chart says it will.
I still think the market could use a bout of volatility.