Microsoft, at a Glance 

In the Microsoft ($MSFT) chart below readers will see a huge Double Bottom pattern of bullish reversal with a $466 pivot. The shares broke out of that pattern, then faltered. It is at that point that these shares found support just above my pivot. I find that encouraging.
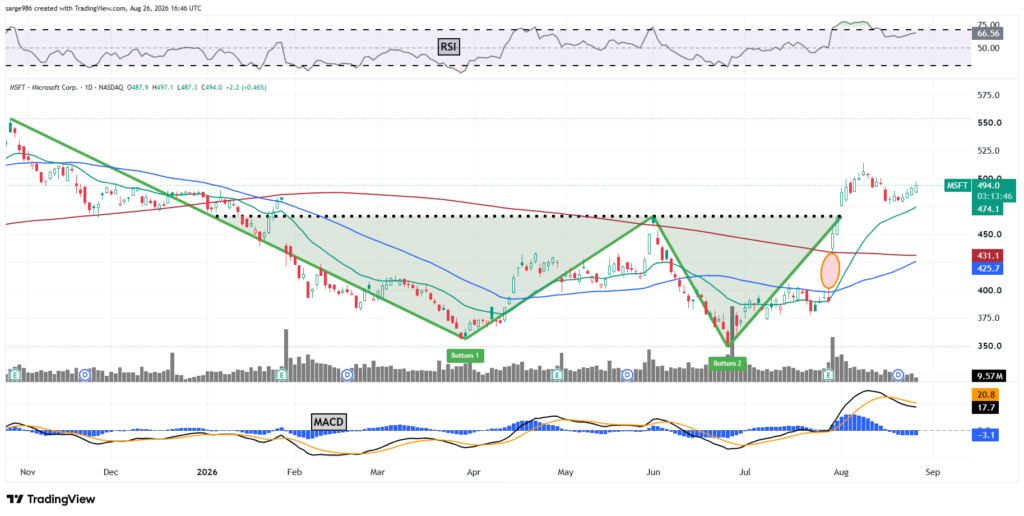
The MACD could be in better shape, but Relative Strength is fine. In addition, the stock looks likely to experience a “golden cross” at some time in the next week to week and a half. That could provide some bullish algorithmic activity when that does occur.

I have no problem reiterating my $582 price target for this name.

Position: Long MSFT equity

Charting Bitcoin

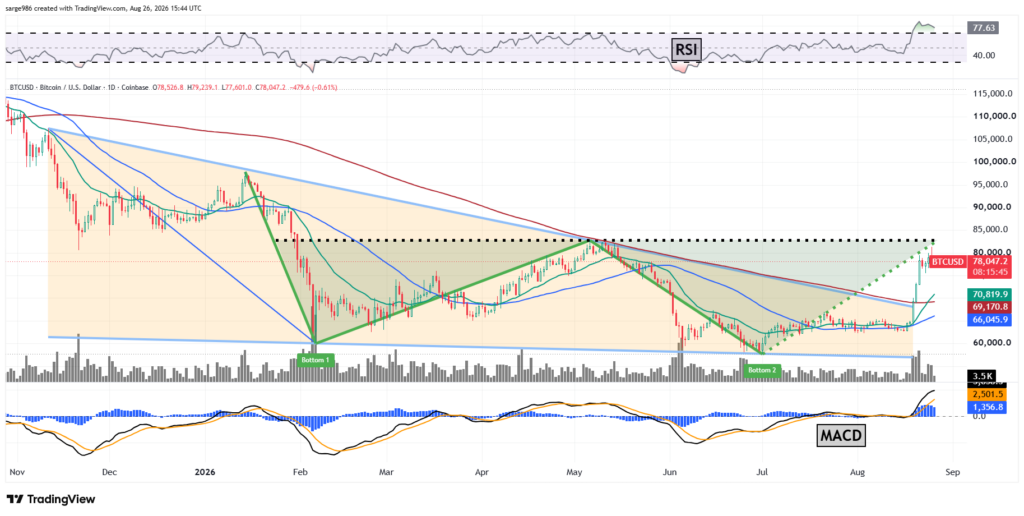
Looking at the chart for Bitcoin, readers will see two nearly simultaneous technical patterns running alongside each other that appear to be bullish in nature. There is a Falling Wedge pattern of bullish reversal that created the August breakout. We now also have a giant Double Bottom pattern, also of bullish reversal. That one may be a problem.

The pivot there sits at just about $81,700. This is close to where BTC appears to have hit resistance this morning. Should Bitcoin fail to take and hold that spot, this pattern will fail and the breakout is over. 

Checking my favored indicators, Relative Strength appears to have apexed and has now entered into a technically overbought state. That said, below the chart, the daily MACD, which is a momentum indicator, looks really bullish. 

The histogram of the 9-day EMA has been in positive territory since mid-August, which is a short-term bullish signal. On top of that, the 12-day EMA is running well above the 26-day EMA. With both of those lines still standing above the zero-bound, the bullish signal is amplified.

Everything really depends upon what happens at the $81,700 pivot point.  

Position: None

Late Morning Tweet

Positions: None.